Immigrants from Barbados vs Immigrants from Bolivia 6th Grade
COMPARE
Immigrants from Barbados
Immigrants from Bolivia
6th Grade
6th Grade Comparison
Immigrants from Barbados
Immigrants from Bolivia
96.1%
6TH GRADE
0.0/ 100
METRIC RATING
292nd/ 347
METRIC RANK
96.3%
6TH GRADE
0.1/ 100
METRIC RATING
272nd/ 347
METRIC RANK
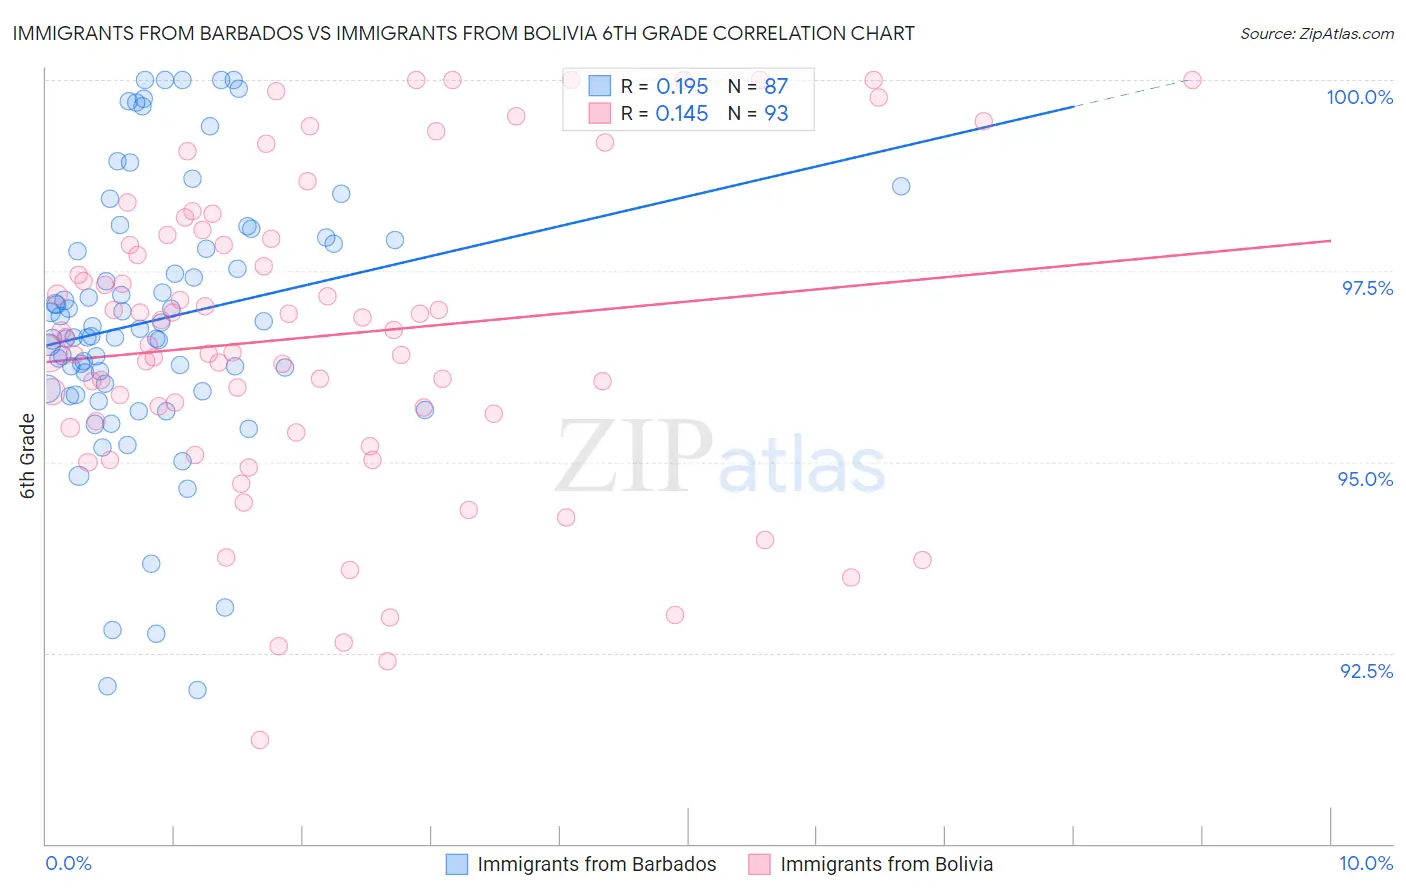
Immigrants from Barbados vs Immigrants from Bolivia 6th Grade Correlation Chart
The statistical analysis conducted on geographies consisting of 112,788,359 people shows a poor positive correlation between the proportion of Immigrants from Barbados and percentage of population with at least 6th grade education in the United States with a correlation coefficient (R) of 0.195 and weighted average of 96.1%. Similarly, the statistical analysis conducted on geographies consisting of 158,718,022 people shows a poor positive correlation between the proportion of Immigrants from Bolivia and percentage of population with at least 6th grade education in the United States with a correlation coefficient (R) of 0.145 and weighted average of 96.3%, a difference of 0.21%.
6th Grade Correlation Summary
| Measurement | Immigrants from Barbados | Immigrants from Bolivia |
| Minimum | 92.0% | 91.4% |
| Maximum | 100.0% | 100.0% |
| Range | 8.0% | 8.6% |
| Mean | 96.9% | 96.6% |
| Median | 96.7% | 96.6% |
| Interquartile 25% (IQ1) | 96.0% | 95.5% |
| Interquartile 75% (IQ3) | 97.9% | 97.9% |
| Interquartile Range (IQR) | 2.0% | 2.5% |
| Standard Deviation (Sample) | 1.8% | 2.0% |
| Standard Deviation (Population) | 1.8% | 2.0% |
Demographics Similar to Immigrants from Barbados and Immigrants from Bolivia by 6th Grade
In terms of 6th grade, the demographic groups most similar to Immigrants from Barbados are Immigrants from Somalia (96.1%, a difference of 0.020%), Immigrants from St. Vincent and the Grenadines (96.1%, a difference of 0.020%), Immigrants from Eritrea (96.1%, a difference of 0.040%), Malaysian (96.2%, a difference of 0.060%), and Immigrants from Trinidad and Tobago (96.2%, a difference of 0.070%). Similarly, the demographic groups most similar to Immigrants from Bolivia are Immigrants from Cameroon (96.3%, a difference of 0.010%), Immigrants from Philippines (96.3%, a difference of 0.010%), Immigrants from Ghana (96.3%, a difference of 0.020%), Yaqui (96.3%, a difference of 0.030%), and Immigrants from Western Africa (96.3%, a difference of 0.040%).
| Demographics | Rating | Rank | 6th Grade |
| Immigrants | Bolivia | 0.1 /100 | #272 | Tragic 96.3% |
| Immigrants | Cameroon | 0.1 /100 | #273 | Tragic 96.3% |
| Immigrants | Philippines | 0.1 /100 | #274 | Tragic 96.3% |
| Immigrants | Ghana | 0.1 /100 | #275 | Tragic 96.3% |
| Yaqui | 0.1 /100 | #276 | Tragic 96.3% |
| Immigrants | Western Africa | 0.1 /100 | #277 | Tragic 96.3% |
| Immigrants | Thailand | 0.1 /100 | #278 | Tragic 96.3% |
| Immigrants | Peru | 0.1 /100 | #279 | Tragic 96.2% |
| Immigrants | Afghanistan | 0.1 /100 | #280 | Tragic 96.2% |
| Trinidadians and Tobagonians | 0.1 /100 | #281 | Tragic 96.2% |
| Houma | 0.1 /100 | #282 | Tragic 96.2% |
| Cubans | 0.1 /100 | #283 | Tragic 96.2% |
| Fijians | 0.1 /100 | #284 | Tragic 96.2% |
| Somalis | 0.1 /100 | #285 | Tragic 96.2% |
| Barbadians | 0.0 /100 | #286 | Tragic 96.2% |
| Immigrants | Trinidad and Tobago | 0.0 /100 | #287 | Tragic 96.2% |
| Malaysians | 0.0 /100 | #288 | Tragic 96.2% |
| Immigrants | Eritrea | 0.0 /100 | #289 | Tragic 96.1% |
| Immigrants | Somalia | 0.0 /100 | #290 | Tragic 96.1% |
| Immigrants | St. Vincent and the Grenadines | 0.0 /100 | #291 | Tragic 96.1% |
| Immigrants | Barbados | 0.0 /100 | #292 | Tragic 96.1% |