Immigrants from Barbados vs Cypriot 6th Grade
COMPARE
Immigrants from Barbados
Cypriot
6th Grade
6th Grade Comparison
Immigrants from Barbados
Cypriots
96.1%
6TH GRADE
0.0/ 100
METRIC RATING
292nd/ 347
METRIC RANK
97.5%
6TH GRADE
98.7/ 100
METRIC RATING
94th/ 347
METRIC RANK
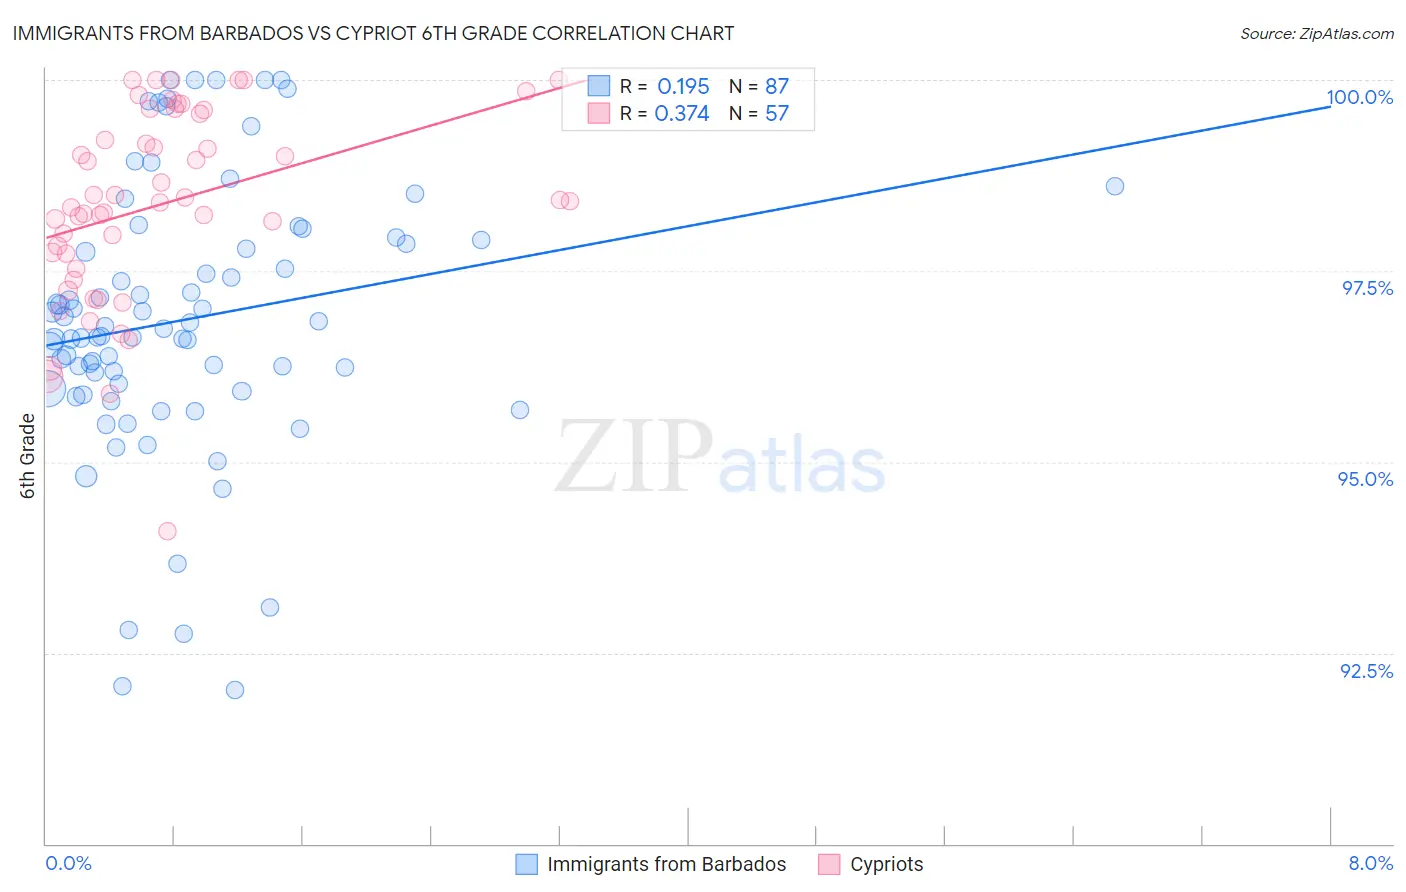
Immigrants from Barbados vs Cypriot 6th Grade Correlation Chart
The statistical analysis conducted on geographies consisting of 112,788,359 people shows a poor positive correlation between the proportion of Immigrants from Barbados and percentage of population with at least 6th grade education in the United States with a correlation coefficient (R) of 0.195 and weighted average of 96.1%. Similarly, the statistical analysis conducted on geographies consisting of 61,870,289 people shows a mild positive correlation between the proportion of Cypriots and percentage of population with at least 6th grade education in the United States with a correlation coefficient (R) of 0.374 and weighted average of 97.5%, a difference of 1.5%.
6th Grade Correlation Summary
| Measurement | Immigrants from Barbados | Cypriot |
| Minimum | 92.0% | 94.1% |
| Maximum | 100.0% | 100.0% |
| Range | 8.0% | 5.9% |
| Mean | 96.9% | 98.4% |
| Median | 96.7% | 98.4% |
| Interquartile 25% (IQ1) | 96.0% | 97.6% |
| Interquartile 75% (IQ3) | 97.9% | 99.6% |
| Interquartile Range (IQR) | 2.0% | 2.0% |
| Standard Deviation (Sample) | 1.8% | 1.3% |
| Standard Deviation (Population) | 1.8% | 1.3% |
Similar Demographics by 6th Grade
Demographics Similar to Immigrants from Barbados by 6th Grade
In terms of 6th grade, the demographic groups most similar to Immigrants from Barbados are Immigrants from Somalia (96.1%, a difference of 0.020%), Immigrants from St. Vincent and the Grenadines (96.1%, a difference of 0.020%), Immigrants from Eritrea (96.1%, a difference of 0.040%), Immigrants from West Indies (96.1%, a difference of 0.040%), and Malaysian (96.2%, a difference of 0.060%).
| Demographics | Rating | Rank | 6th Grade |
| Somalis | 0.1 /100 | #285 | Tragic 96.2% |
| Barbadians | 0.0 /100 | #286 | Tragic 96.2% |
| Immigrants | Trinidad and Tobago | 0.0 /100 | #287 | Tragic 96.2% |
| Malaysians | 0.0 /100 | #288 | Tragic 96.2% |
| Immigrants | Eritrea | 0.0 /100 | #289 | Tragic 96.1% |
| Immigrants | Somalia | 0.0 /100 | #290 | Tragic 96.1% |
| Immigrants | St. Vincent and the Grenadines | 0.0 /100 | #291 | Tragic 96.1% |
| Immigrants | Barbados | 0.0 /100 | #292 | Tragic 96.1% |
| Immigrants | West Indies | 0.0 /100 | #293 | Tragic 96.1% |
| British West Indians | 0.0 /100 | #294 | Tragic 96.0% |
| Immigrants | Grenada | 0.0 /100 | #295 | Tragic 95.9% |
| Immigrants | South Eastern Asia | 0.0 /100 | #296 | Tragic 95.9% |
| Haitians | 0.0 /100 | #297 | Tragic 95.8% |
| Sri Lankans | 0.0 /100 | #298 | Tragic 95.8% |
| Immigrants | Laos | 0.0 /100 | #299 | Tragic 95.7% |
Demographics Similar to Cypriots by 6th Grade
In terms of 6th grade, the demographic groups most similar to Cypriots are Romanian (97.5%, a difference of 0.0%), Cree (97.5%, a difference of 0.0%), Immigrants from Ireland (97.5%, a difference of 0.0%), Immigrants from Germany (97.5%, a difference of 0.0%), and Immigrants from Sweden (97.5%, a difference of 0.0%).
| Demographics | Rating | Rank | 6th Grade |
| Puget Sound Salish | 98.9 /100 | #87 | Exceptional 97.5% |
| Immigrants | South Africa | 98.9 /100 | #88 | Exceptional 97.5% |
| Immigrants | Australia | 98.8 /100 | #89 | Exceptional 97.5% |
| Pueblo | 98.8 /100 | #90 | Exceptional 97.5% |
| Immigrants | Western Europe | 98.8 /100 | #91 | Exceptional 97.5% |
| Romanians | 98.7 /100 | #92 | Exceptional 97.5% |
| Cree | 98.7 /100 | #93 | Exceptional 97.5% |
| Cypriots | 98.7 /100 | #94 | Exceptional 97.5% |
| Immigrants | Ireland | 98.7 /100 | #95 | Exceptional 97.5% |
| Immigrants | Germany | 98.6 /100 | #96 | Exceptional 97.5% |
| Immigrants | Sweden | 98.6 /100 | #97 | Exceptional 97.5% |
| Immigrants | Denmark | 98.5 /100 | #98 | Exceptional 97.5% |
| Yugoslavians | 98.5 /100 | #99 | Exceptional 97.5% |
| Turks | 98.3 /100 | #100 | Exceptional 97.5% |
| South Africans | 98.2 /100 | #101 | Exceptional 97.5% |