Immigrants from Bangladesh vs Spaniard Master's Degree
COMPARE
Immigrants from Bangladesh
Spaniard
Master's Degree
Master's Degree Comparison
Immigrants from Bangladesh
Spaniards
15.5%
MASTER'S DEGREE
76.1/ 100
METRIC RATING
155th/ 347
METRIC RANK
14.6%
MASTER'S DEGREE
35.8/ 100
METRIC RATING
190th/ 347
METRIC RANK
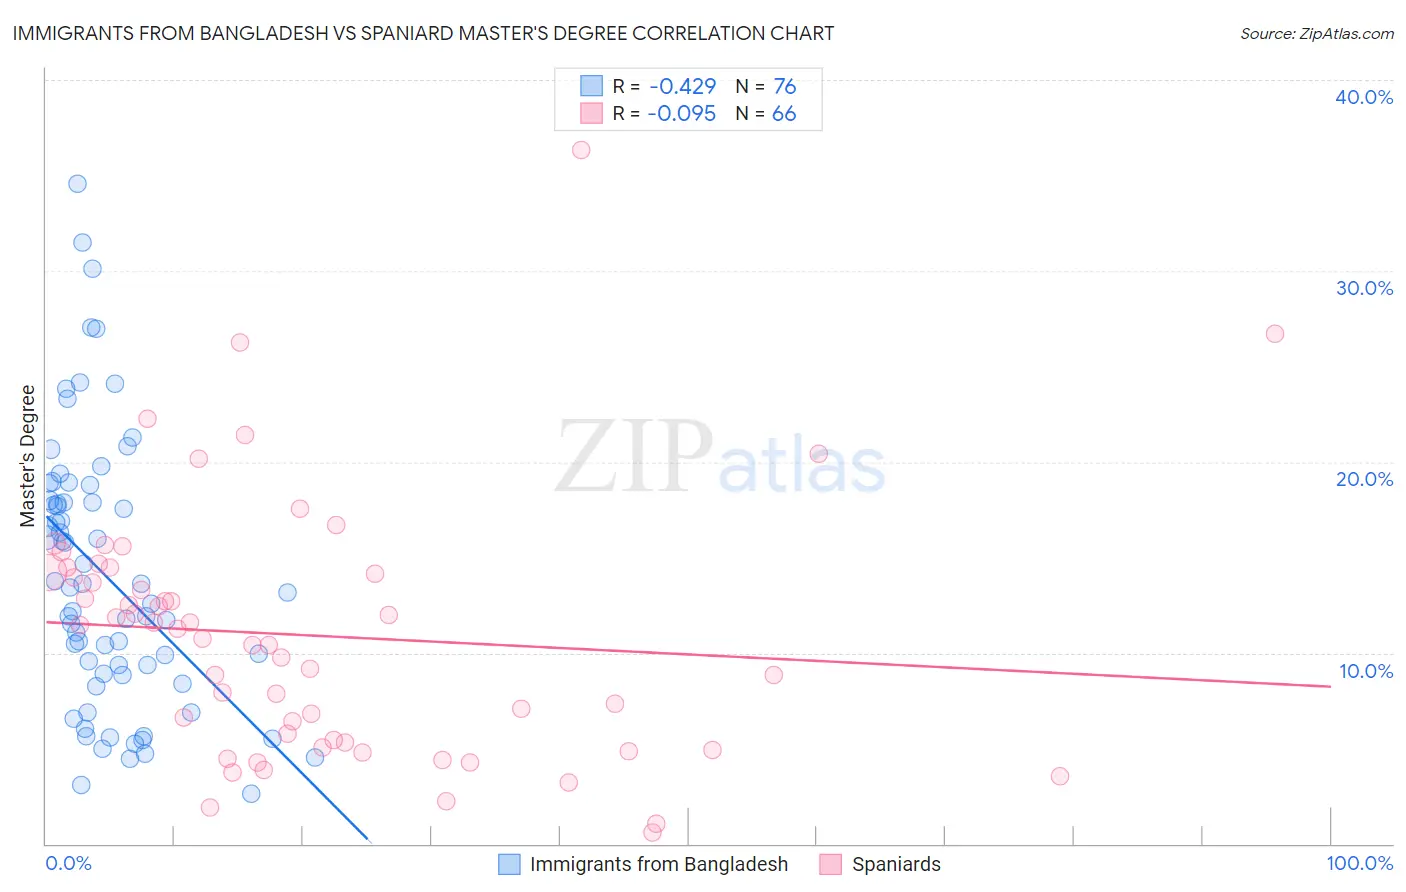
Immigrants from Bangladesh vs Spaniard Master's Degree Correlation Chart
The statistical analysis conducted on geographies consisting of 203,660,853 people shows a moderate negative correlation between the proportion of Immigrants from Bangladesh and percentage of population with at least master's degree education in the United States with a correlation coefficient (R) of -0.429 and weighted average of 15.5%. Similarly, the statistical analysis conducted on geographies consisting of 443,325,255 people shows a slight negative correlation between the proportion of Spaniards and percentage of population with at least master's degree education in the United States with a correlation coefficient (R) of -0.095 and weighted average of 14.6%, a difference of 5.7%.
Master's Degree Correlation Summary
| Measurement | Immigrants from Bangladesh | Spaniard |
| Minimum | 2.6% | 0.56% |
| Maximum | 34.6% | 36.4% |
| Range | 31.9% | 35.8% |
| Mean | 14.0% | 10.9% |
| Median | 13.3% | 11.0% |
| Interquartile 25% (IQ1) | 8.9% | 5.3% |
| Interquartile 75% (IQ3) | 17.9% | 14.2% |
| Interquartile Range (IQR) | 9.1% | 8.9% |
| Standard Deviation (Sample) | 7.0% | 6.7% |
| Standard Deviation (Population) | 7.0% | 6.6% |
Similar Demographics by Master's Degree
Demographics Similar to Immigrants from Bangladesh by Master's Degree
In terms of master's degree, the demographic groups most similar to Immigrants from Bangladesh are Immigrants from South America (15.5%, a difference of 0.040%), Icelander (15.5%, a difference of 0.13%), Slavic (15.5%, a difference of 0.16%), Iraqi (15.5%, a difference of 0.21%), and Slovene (15.5%, a difference of 0.33%).
| Demographics | Rating | Rank | Master's Degree |
| Immigrants | Senegal | 78.2 /100 | #148 | Good 15.5% |
| Ghanaians | 78.2 /100 | #149 | Good 15.5% |
| Slovenes | 78.0 /100 | #150 | Good 15.5% |
| Iraqis | 77.3 /100 | #151 | Good 15.5% |
| Slavs | 77.0 /100 | #152 | Good 15.5% |
| Icelanders | 76.8 /100 | #153 | Good 15.5% |
| Immigrants | South America | 76.3 /100 | #154 | Good 15.5% |
| Immigrants | Bangladesh | 76.1 /100 | #155 | Good 15.5% |
| Bermudans | 73.9 /100 | #156 | Good 15.4% |
| Immigrants | Cameroon | 71.7 /100 | #157 | Good 15.4% |
| Immigrants | Poland | 71.5 /100 | #158 | Good 15.4% |
| Luxembourgers | 71.0 /100 | #159 | Good 15.3% |
| Kenyans | 70.3 /100 | #160 | Good 15.3% |
| Sudanese | 68.7 /100 | #161 | Good 15.3% |
| Peruvians | 68.7 /100 | #162 | Good 15.3% |
Demographics Similar to Spaniards by Master's Degree
In terms of master's degree, the demographic groups most similar to Spaniards are Immigrants (14.6%, a difference of 0.020%), Immigrants from Costa Rica (14.7%, a difference of 0.060%), Basque (14.7%, a difference of 0.10%), Immigrants from Oceania (14.7%, a difference of 0.19%), and Welsh (14.6%, a difference of 0.23%).
| Demographics | Rating | Rank | Master's Degree |
| Sri Lankans | 39.6 /100 | #183 | Fair 14.7% |
| Immigrants | Zaire | 39.5 /100 | #184 | Fair 14.7% |
| Barbadians | 38.3 /100 | #185 | Fair 14.7% |
| Immigrants | Oceania | 37.1 /100 | #186 | Fair 14.7% |
| Basques | 36.5 /100 | #187 | Fair 14.7% |
| Immigrants | Costa Rica | 36.2 /100 | #188 | Fair 14.7% |
| Immigrants | Immigrants | 36.0 /100 | #189 | Fair 14.6% |
| Spaniards | 35.8 /100 | #190 | Fair 14.6% |
| Welsh | 34.2 /100 | #191 | Fair 14.6% |
| Immigrants | Middle Africa | 33.6 /100 | #192 | Fair 14.6% |
| Immigrants | Nigeria | 32.7 /100 | #193 | Fair 14.6% |
| Chinese | 32.5 /100 | #194 | Fair 14.6% |
| Danes | 31.3 /100 | #195 | Fair 14.5% |
| Czechoslovakians | 29.9 /100 | #196 | Fair 14.5% |
| Belgians | 28.0 /100 | #197 | Fair 14.5% |