Immigrants from Bangladesh vs Spaniard 8th Grade
COMPARE
Immigrants from Bangladesh
Spaniard
8th Grade
8th Grade Comparison
Immigrants from Bangladesh
Spaniards
93.6%
8TH GRADE
0.0/ 100
METRIC RATING
311th/ 347
METRIC RANK
95.8%
8TH GRADE
60.0/ 100
METRIC RATING
167th/ 347
METRIC RANK
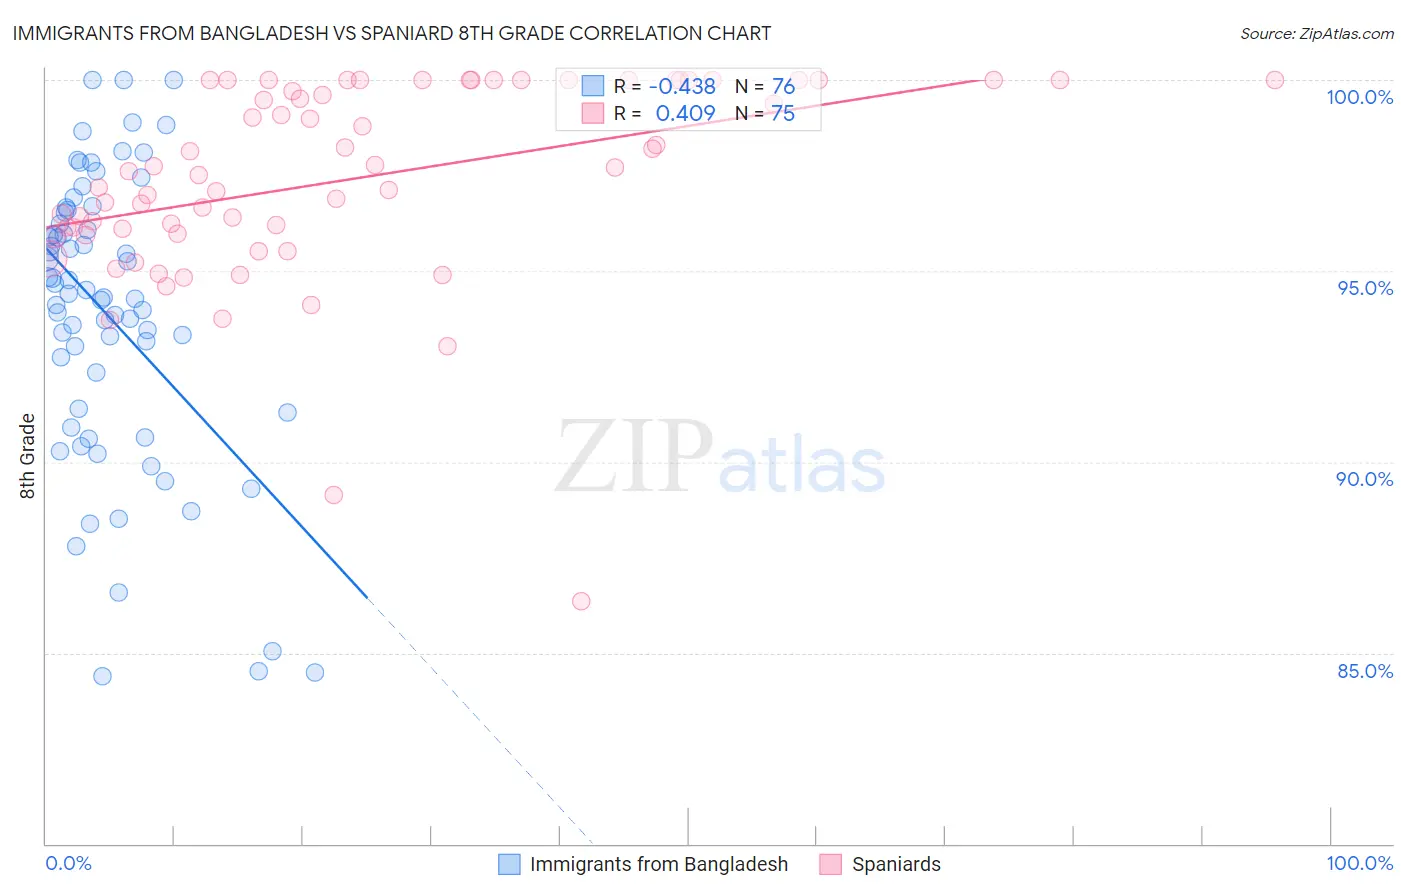
Immigrants from Bangladesh vs Spaniard 8th Grade Correlation Chart
The statistical analysis conducted on geographies consisting of 203,672,706 people shows a moderate negative correlation between the proportion of Immigrants from Bangladesh and percentage of population with at least 8th grade education in the United States with a correlation coefficient (R) of -0.438 and weighted average of 93.6%. Similarly, the statistical analysis conducted on geographies consisting of 443,544,503 people shows a moderate positive correlation between the proportion of Spaniards and percentage of population with at least 8th grade education in the United States with a correlation coefficient (R) of 0.409 and weighted average of 95.8%, a difference of 2.4%.
8th Grade Correlation Summary
| Measurement | Immigrants from Bangladesh | Spaniard |
| Minimum | 84.4% | 86.4% |
| Maximum | 100.0% | 100.0% |
| Range | 15.6% | 13.6% |
| Mean | 93.8% | 97.4% |
| Median | 94.3% | 97.6% |
| Interquartile 25% (IQ1) | 91.3% | 96.0% |
| Interquartile 75% (IQ3) | 96.4% | 100.0% |
| Interquartile Range (IQR) | 5.1% | 4.0% |
| Standard Deviation (Sample) | 3.8% | 2.6% |
| Standard Deviation (Population) | 3.7% | 2.6% |
Similar Demographics by 8th Grade
Demographics Similar to Immigrants from Bangladesh by 8th Grade
In terms of 8th grade, the demographic groups most similar to Immigrants from Bangladesh are Japanese (93.6%, a difference of 0.0%), Immigrants (93.6%, a difference of 0.010%), Ecuadorian (93.6%, a difference of 0.030%), Cape Verdean (93.5%, a difference of 0.040%), and Immigrants from Caribbean (93.5%, a difference of 0.070%).
| Demographics | Rating | Rank | 8th Grade |
| Guyanese | 0.0 /100 | #304 | Tragic 93.9% |
| Immigrants | Haiti | 0.0 /100 | #305 | Tragic 93.9% |
| Immigrants | Guyana | 0.0 /100 | #306 | Tragic 93.8% |
| Immigrants | Portugal | 0.0 /100 | #307 | Tragic 93.8% |
| Ecuadorians | 0.0 /100 | #308 | Tragic 93.6% |
| Immigrants | Immigrants | 0.0 /100 | #309 | Tragic 93.6% |
| Japanese | 0.0 /100 | #310 | Tragic 93.6% |
| Immigrants | Bangladesh | 0.0 /100 | #311 | Tragic 93.6% |
| Cape Verdeans | 0.0 /100 | #312 | Tragic 93.5% |
| Immigrants | Caribbean | 0.0 /100 | #313 | Tragic 93.5% |
| Immigrants | Vietnam | 0.0 /100 | #314 | Tragic 93.5% |
| Vietnamese | 0.0 /100 | #315 | Tragic 93.5% |
| Immigrants | Cambodia | 0.0 /100 | #316 | Tragic 93.3% |
| Immigrants | Ecuador | 0.0 /100 | #317 | Tragic 93.3% |
| Puerto Ricans | 0.0 /100 | #318 | Tragic 93.2% |
Demographics Similar to Spaniards by 8th Grade
In terms of 8th grade, the demographic groups most similar to Spaniards are Immigrants from Ukraine (95.8%, a difference of 0.0%), Alsatian (95.8%, a difference of 0.010%), Immigrants from Poland (95.8%, a difference of 0.010%), Immigrants from Iran (95.8%, a difference of 0.010%), and Ute (95.8%, a difference of 0.010%).
| Demographics | Rating | Rank | 8th Grade |
| Seminole | 67.7 /100 | #160 | Good 95.8% |
| Bermudans | 67.5 /100 | #161 | Good 95.8% |
| Immigrants | Kenya | 67.2 /100 | #162 | Good 95.8% |
| Immigrants | Sri Lanka | 64.1 /100 | #163 | Good 95.8% |
| Immigrants | Italy | 63.5 /100 | #164 | Good 95.8% |
| Alsatians | 61.4 /100 | #165 | Good 95.8% |
| Immigrants | Poland | 61.1 /100 | #166 | Good 95.8% |
| Spaniards | 60.0 /100 | #167 | Good 95.8% |
| Immigrants | Ukraine | 59.5 /100 | #168 | Average 95.8% |
| Immigrants | Iran | 58.6 /100 | #169 | Average 95.8% |
| Ute | 58.5 /100 | #170 | Average 95.8% |
| Egyptians | 58.2 /100 | #171 | Average 95.8% |
| Immigrants | Korea | 57.9 /100 | #172 | Average 95.8% |
| Mongolians | 53.0 /100 | #173 | Average 95.8% |
| Chileans | 50.0 /100 | #174 | Average 95.7% |