Immigrants from Bahamas vs Paiute GED/Equivalency
COMPARE
Immigrants from Bahamas
Paiute
GED/Equivalency
GED/Equivalency Comparison
Immigrants from Bahamas
Paiute
84.2%
GED/EQUIVALENCY
2.6/ 100
METRIC RATING
239th/ 347
METRIC RANK
82.0%
GED/EQUIVALENCY
0.0/ 100
METRIC RATING
292nd/ 347
METRIC RANK
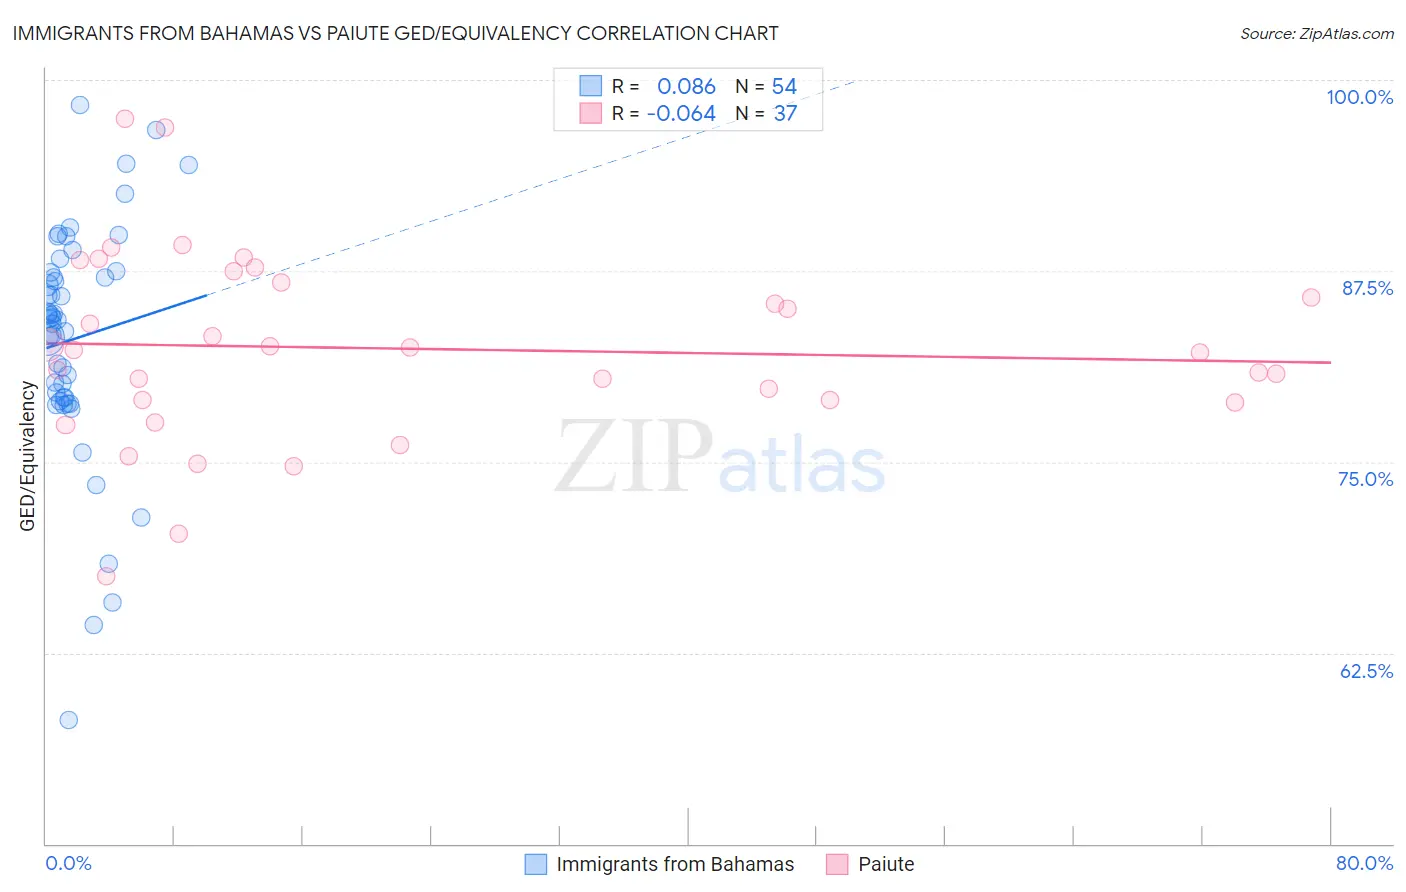
Immigrants from Bahamas vs Paiute GED/Equivalency Correlation Chart
The statistical analysis conducted on geographies consisting of 104,666,801 people shows a slight positive correlation between the proportion of Immigrants from Bahamas and percentage of population with at least ged/equivalency education in the United States with a correlation coefficient (R) of 0.086 and weighted average of 84.2%. Similarly, the statistical analysis conducted on geographies consisting of 58,404,221 people shows a slight negative correlation between the proportion of Paiute and percentage of population with at least ged/equivalency education in the United States with a correlation coefficient (R) of -0.064 and weighted average of 82.0%, a difference of 2.6%.
GED/Equivalency Correlation Summary
| Measurement | Immigrants from Bahamas | Paiute |
| Minimum | 58.1% | 67.5% |
| Maximum | 98.3% | 97.4% |
| Range | 40.3% | 29.9% |
| Mean | 83.0% | 82.4% |
| Median | 84.3% | 82.3% |
| Interquartile 25% (IQ1) | 79.2% | 79.0% |
| Interquartile 75% (IQ3) | 87.4% | 87.1% |
| Interquartile Range (IQR) | 8.2% | 8.1% |
| Standard Deviation (Sample) | 7.7% | 6.3% |
| Standard Deviation (Population) | 7.7% | 6.2% |
Similar Demographics by GED/Equivalency
Demographics Similar to Immigrants from Bahamas by GED/Equivalency
In terms of ged/equivalency, the demographic groups most similar to Immigrants from Bahamas are Immigrants from South Eastern Asia (84.1%, a difference of 0.020%), Immigrants from Peru (84.2%, a difference of 0.030%), Subsaharan African (84.2%, a difference of 0.090%), Senegalese (84.0%, a difference of 0.15%), and Ghanaian (84.3%, a difference of 0.16%).
| Demographics | Rating | Rank | GED/Equivalency |
| Immigrants | South America | 4.2 /100 | #232 | Tragic 84.4% |
| Immigrants | Panama | 4.1 /100 | #233 | Tragic 84.4% |
| Immigrants | Nigeria | 3.6 /100 | #234 | Tragic 84.3% |
| Ghanaians | 3.5 /100 | #235 | Tragic 84.3% |
| Immigrants | Eritrea | 3.5 /100 | #236 | Tragic 84.3% |
| Sub-Saharan Africans | 3.0 /100 | #237 | Tragic 84.2% |
| Immigrants | Peru | 2.7 /100 | #238 | Tragic 84.2% |
| Immigrants | Bahamas | 2.6 /100 | #239 | Tragic 84.2% |
| Immigrants | South Eastern Asia | 2.5 /100 | #240 | Tragic 84.1% |
| Senegalese | 1.9 /100 | #241 | Tragic 84.0% |
| Sri Lankans | 1.9 /100 | #242 | Tragic 84.0% |
| Cherokee | 1.3 /100 | #243 | Tragic 83.9% |
| Immigrants | Ghana | 1.3 /100 | #244 | Tragic 83.9% |
| Immigrants | Senegal | 1.2 /100 | #245 | Tragic 83.8% |
| Chickasaw | 1.2 /100 | #246 | Tragic 83.8% |
Demographics Similar to Paiute by GED/Equivalency
In terms of ged/equivalency, the demographic groups most similar to Paiute are British West Indian (82.0%, a difference of 0.010%), Immigrants from St. Vincent and the Grenadines (82.0%, a difference of 0.030%), Cuban (82.0%, a difference of 0.040%), Haitian (82.1%, a difference of 0.060%), and Nepalese (81.9%, a difference of 0.090%).
| Demographics | Rating | Rank | GED/Equivalency |
| Cajuns | 0.0 /100 | #285 | Tragic 82.4% |
| Immigrants | West Indies | 0.0 /100 | #286 | Tragic 82.4% |
| Japanese | 0.0 /100 | #287 | Tragic 82.4% |
| Pueblo | 0.0 /100 | #288 | Tragic 82.3% |
| Immigrants | Cambodia | 0.0 /100 | #289 | Tragic 82.2% |
| Haitians | 0.0 /100 | #290 | Tragic 82.1% |
| Cubans | 0.0 /100 | #291 | Tragic 82.0% |
| Paiute | 0.0 /100 | #292 | Tragic 82.0% |
| British West Indians | 0.0 /100 | #293 | Tragic 82.0% |
| Immigrants | St. Vincent and the Grenadines | 0.0 /100 | #294 | Tragic 82.0% |
| Nepalese | 0.0 /100 | #295 | Tragic 81.9% |
| Vietnamese | 0.0 /100 | #296 | Tragic 81.9% |
| Immigrants | Bangladesh | 0.0 /100 | #297 | Tragic 81.9% |
| Ute | 0.0 /100 | #298 | Tragic 81.8% |
| Ecuadorians | 0.0 /100 | #299 | Tragic 81.7% |