Hungarian vs Nicaraguan Associate's Degree

COMPARE

Hungarian
Race
Ancestry
AfghanAfricanAlaska NativeAlaskan AthabascanAlbanianAleutAlsatianAmericanApacheArabArapahoArgentineanArmenianAssyrian/Chaldean/SyriacAustralianAustrianBahamianBangladeshiBarbadianBasqueBelgianBelizeanBermudanBhutaneseBlackfeetBolivianBrazilianBritishBritish West IndianBulgarianBurmeseCajunCambodianCanadianCape VerdeanCarpatho RusynCelticCentral AmericanCentral American IndianCherokeeCheyenneChickasawChileanChineseChippewaChoctawColombianColvilleComancheCosta RicanCreeCreekCroatianCrowCubanCypriotCzechCzechoslovakianDanishDelawareDominicanDutchDutch West IndianEastern EuropeanEcuadorianEgyptianEnglishEstonianEthiopianEuropeanFijianFilipinoFinnishFrenchFrench American IndianFrench CanadianGermanGerman RussianGhanaianGreekGuamanian/ChamorroGuatemalanGuyaneseHaitianHmongHonduranHopiHoumaHungarianIcelanderIndian (Asian)IndonesianInupiatIranianIraqiIrishIroquoisIsraeliItalianJamaicanJapaneseJordanianKenyanKiowaKoreanLaotianLatvianLebaneseLiberianLithuanianLumbeeLuxembourgerMacedonianMalaysianMalteseMarshalleseMenomineeMexicanMexican American IndianMongolianMoroccanNative HawaiianNavajoNepaleseNew ZealanderNigerianNorthern EuropeanNorwegianOkinawanOsageOttawaPaiutePakistaniPalestinianPanamanianParaguayanPennsylvania GermanPeruvianPimaPolishPortuguesePotawatomiPuebloPuerto RicanPuget Sound SalishRomanianRussianSalvadoranSamoanScandinavianScotch-IrishScottishSeminoleSenegaleseSerbianShoshoneSierra LeoneanSiouxSlavicSlovakSloveneSomaliSouth AfricanSouth AmericanSouth American IndianSoviet UnionSpaniardSpanishSpanish AmericanSpanish American IndianSri LankanSubsaharan AfricanSudaneseSwedishSwissSyrianTaiwaneseThaiTlingit-HaidaTohono O'OdhamTonganTrinidadian and TobagonianTsimshianTurkishU.S. Virgin IslanderUgandanUkrainianUruguayanUteVenezuelanVietnameseWelshWest IndianYakamaYaquiYugoslavianYumanYup'ikZimbabwean
Immigration
NonimmigrantsImmigrantsAfghanistanAfricaAlbaniaArgentinaArmeniaAsiaAustraliaAustriaBahamasBangladeshBarbadosBelarusBelgiumBelizeBoliviaBosnia and HerzegovinaBrazilBulgariaBurma/MyanmarCabo VerdeCambodiaCameroonCanadaCaribbeanCentral AmericaChileChinaColombiaCongoCosta RicaCroatiaCubaCzechoslovakiaDenmarkDominicaDominican RepublicEastern AfricaEastern AsiaEastern EuropeEcuadorEgyptEl SalvadorEnglandEritreaEthiopiaEuropeFijiFranceGermanyGhanaGreeceGrenadaGuatemalaGuyanaHaitiHondurasHong KongHungaryIndiaIndonesiaIranIraqIrelandIsraelItalyJamaicaJapanJordanKazakhstanKenyaKoreaKuwaitLaosLatin AmericaLatviaLebanonLiberiaLithuaniaMalaysiaMexicoMicronesiaMiddle AfricaMoldovaMoroccoNepalNetherlandsNicaraguaNigeriaNorth AmericaNorth MacedoniaNorthern AfricaNorthern EuropeNorwayOceaniaPakistanPanamaPeruPhilippinesPolandPortugalRomaniaRussiaSaudi ArabiaScotlandSenegalSerbiaSierra LeoneSingaporeSomaliaSouth AfricaSouth AmericaSouth Central AsiaSouth Eastern AsiaSouthern EuropeSpainSri LankaSt. Vincent and the GrenadinesSudanSwedenSwitzerlandSyriaTaiwanThailandTrinidad and TobagoTurkeyUgandaUkraineUruguayUzbekistanVenezuelaVietnamWest IndiesWestern AfricaWestern AsiaWestern EuropeYemenZaireZimbabweAzores
Nicaraguan
Race
Ancestry
AfghanAfricanAlaska NativeAlaskan AthabascanAlbanianAleutAlsatianAmericanApacheArabArapahoArgentineanArmenianAssyrian/Chaldean/SyriacAustralianAustrianBahamianBangladeshiBarbadianBasqueBelgianBelizeanBermudanBhutaneseBlackfeetBolivianBrazilianBritishBritish West IndianBulgarianBurmeseCajunCambodianCanadianCape VerdeanCarpatho RusynCelticCentral AmericanCentral American IndianCherokeeCheyenneChickasawChileanChineseChippewaChoctawColombianColvilleComancheCosta RicanCreeCreekCroatianCrowCubanCypriotCzechCzechoslovakianDanishDelawareDominicanDutchDutch West IndianEastern EuropeanEcuadorianEgyptianEnglishEstonianEthiopianEuropeanFijianFilipinoFinnishFrenchFrench American IndianFrench CanadianGermanGerman RussianGhanaianGreekGuamanian/ChamorroGuatemalanGuyaneseHaitianHmongHonduranHopiHoumaIcelanderIndian (Asian)IndonesianInupiatIranianIraqiIrishIroquoisIsraeliItalianJamaicanJapaneseJordanianKenyanKiowaKoreanLaotianLatvianLebaneseLiberianLithuanianLumbeeLuxembourgerMacedonianMalaysianMalteseMarshalleseMenomineeMexicanMexican American IndianMongolianMoroccanNative HawaiianNavajoNepaleseNew ZealanderNicaraguanNigerianNorthern EuropeanNorwegianOkinawanOsageOttawaPaiutePakistaniPalestinianPanamanianParaguayanPennsylvania GermanPeruvianPimaPolishPortuguesePotawatomiPuebloPuerto RicanPuget Sound SalishRomanianRussianSalvadoranSamoanScandinavianScotch-IrishScottishSeminoleSenegaleseSerbianShoshoneSierra LeoneanSiouxSlavicSlovakSloveneSomaliSouth AfricanSouth AmericanSouth American IndianSoviet UnionSpaniardSpanishSpanish AmericanSpanish American IndianSri LankanSubsaharan AfricanSudaneseSwedishSwissSyrianTaiwaneseThaiTlingit-HaidaTohono O'OdhamTonganTrinidadian and TobagonianTsimshianTurkishU.S. Virgin IslanderUgandanUkrainianUruguayanUteVenezuelanVietnameseWelshWest IndianYakamaYaquiYugoslavianYumanYup'ikZimbabwean
Immigration
NonimmigrantsImmigrantsAfghanistanAfricaAlbaniaArgentinaArmeniaAsiaAustraliaAustriaBahamasBangladeshBarbadosBelarusBelgiumBelizeBoliviaBosnia and HerzegovinaBrazilBulgariaBurma/MyanmarCabo VerdeCambodiaCameroonCanadaCaribbeanCentral AmericaChileChinaColombiaCongoCosta RicaCroatiaCubaCzechoslovakiaDenmarkDominicaDominican RepublicEastern AfricaEastern AsiaEastern EuropeEcuadorEgyptEl SalvadorEnglandEritreaEthiopiaEuropeFijiFranceGermanyGhanaGreeceGrenadaGuatemalaGuyanaHaitiHondurasHong KongHungaryIndiaIndonesiaIranIraqIrelandIsraelItalyJamaicaJapanJordanKazakhstanKenyaKoreaKuwaitLaosLatin AmericaLatviaLebanonLiberiaLithuaniaMalaysiaMexicoMicronesiaMiddle AfricaMoldovaMoroccoNepalNetherlandsNicaraguaNigeriaNorth AmericaNorth MacedoniaNorthern AfricaNorthern EuropeNorwayOceaniaPakistanPanamaPeruPhilippinesPolandPortugalRomaniaRussiaSaudi ArabiaScotlandSenegalSerbiaSierra LeoneSingaporeSomaliaSouth AfricaSouth AmericaSouth Central AsiaSouth Eastern AsiaSouthern EuropeSpainSri LankaSt. Vincent and the GrenadinesSudanSwedenSwitzerlandSyriaTaiwanThailandTrinidad and TobagoTurkeyUgandaUkraineUruguayUzbekistanVenezuelaVietnamWest IndiesWestern AfricaWestern AsiaWestern EuropeYemenZaireZimbabweAzores
Associate's Degree
Income
Poverty
Unemployment
Labor Participation
Family Structure
Vehicle Availability
Education Level
Disability

Associate's Degree Comparison

Hungarians

Nicaraguans

Average
Tragic
46.7%
ASSOCIATE'S DEGREE
59.3/ 100
METRIC RATING
166th/ 347
METRIC RANK
41.5%
ASSOCIATE'S DEGREE
0.4/ 100
METRIC RATING
261st/ 347
METRIC RANK

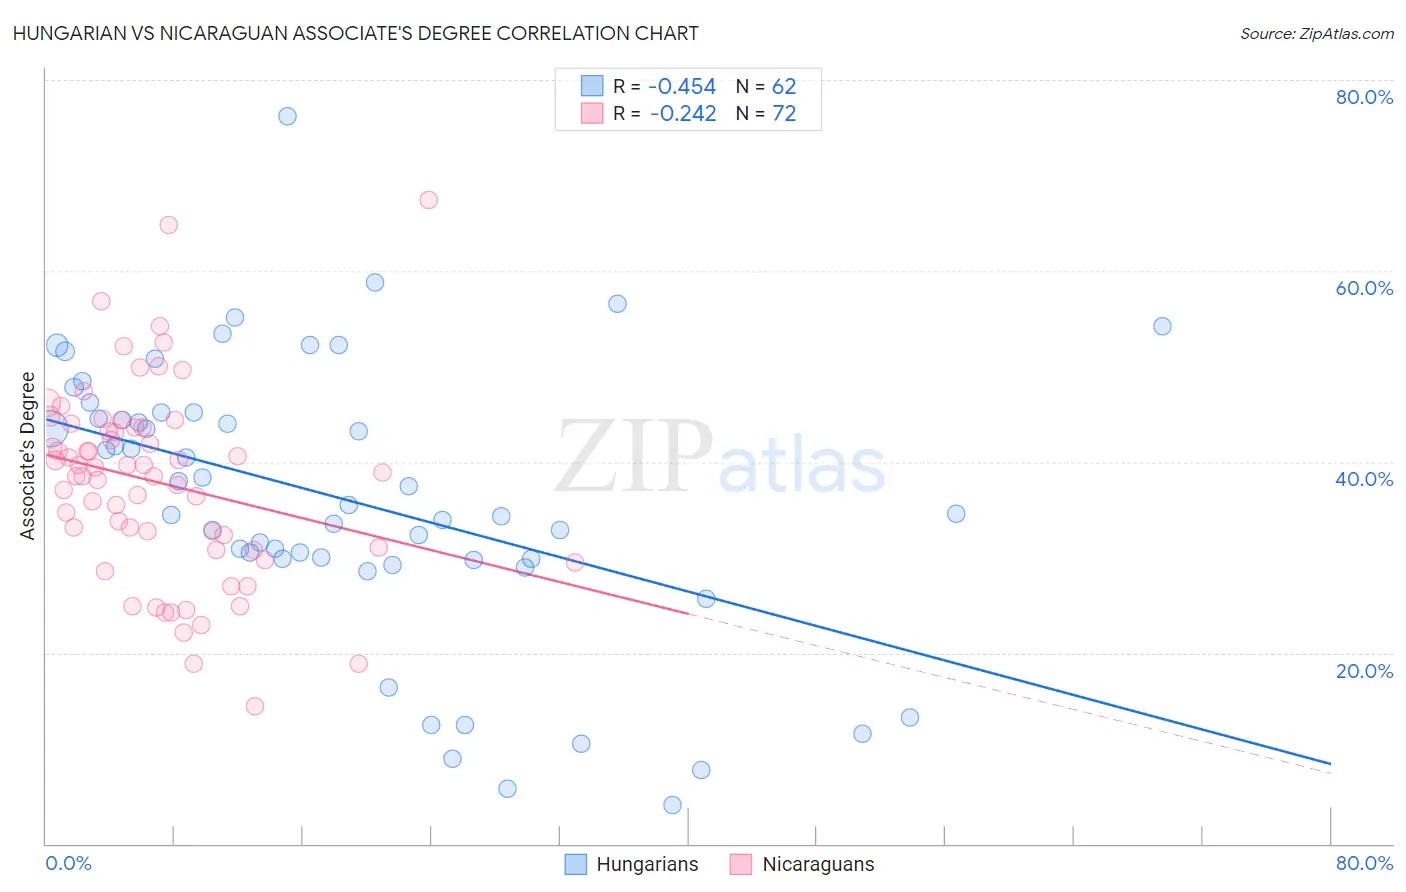
Hungarian vs Nicaraguan Associate's Degree Correlation Chart

The statistical analysis conducted on geographies consisting of 486,216,105 people shows a moderate negative correlation between the proportion of Hungarians and percentage of population with at least associate's degree education in the United States with a correlation coefficient (R) of -0.454 and weighted average of 46.7%. Similarly, the statistical analysis conducted on geographies consisting of 285,707,386 people shows a weak negative correlation between the proportion of Nicaraguans and percentage of population with at least associate's degree education in the United States with a correlation coefficient (R) of -0.242 and weighted average of 41.5%, a difference of 12.5%.
Hungarian vs Nicaraguan Associate's Degree

Associate's Degree Correlation Summary

MeasurementHungarianNicaraguan
Minimum4.0%14.4%
Maximum76.2%67.4%
Range72.2%53.0%
Mean35.9%37.8%
Median35.0%38.7%
Interquartile 25% (IQ1)29.9%30.9%
Interquartile 75% (IQ3)45.2%43.6%
Interquartile Range (IQR)15.3%12.7%
Standard Deviation (Sample)14.7%10.2%
Standard Deviation (Population)14.6%10.1%

Similar Demographics by Associate's Degree

Demographics Similar to Hungarians by Associate's Degree

In terms of associate's degree, the demographic groups most similar to Hungarians are Immigrants from Sierra Leone (46.7%, a difference of 0.010%), Immigrants from South America (46.7%, a difference of 0.040%), Colombian (46.8%, a difference of 0.24%), Somali (46.8%, a difference of 0.25%), and Immigrants from Somalia (46.5%, a difference of 0.29%).
DemographicsRating | RankAssociate's Degree
Immigrants | Poland
69.2
/100
|
#159
Good
47.1%
Scottish
65.4
/100
|
#160
Good
46.9%
Scandinavians
65.2
/100
|
#161
Good
46.9%
Immigrants | Africa
63.2
/100
|
#162
Good
46.8%
Somalis
62.5
/100
|
#163
Good
46.8%
Colombians
62.4
/100
|
#164
Good
46.8%
Immigrants | South America
59.9
/100
|
#165
Average
46.7%
Hungarians
59.3
/100
|
#166
Average
46.7%
Immigrants | Sierra Leone
59.2
/100
|
#167
Average
46.7%
Immigrants | Somalia
55.5
/100
|
#168
Average
46.5%
Uruguayans
55.4
/100
|
#169
Average
46.5%
Irish
53.6
/100
|
#170
Average
46.5%
Basques
52.8
/100
|
#171
Average
46.5%
Peruvians
50.5
/100
|
#172
Average
46.4%
Immigrants | Iraq
50.3
/100
|
#173
Average
46.4%

Demographics Similar to Nicaraguans by Associate's Degree

In terms of associate's degree, the demographic groups most similar to Nicaraguans are Bahamian (41.5%, a difference of 0.090%), Immigrants from Jamaica (41.5%, a difference of 0.11%), Osage (41.5%, a difference of 0.12%), Marshallese (41.6%, a difference of 0.13%), and Malaysian (41.6%, a difference of 0.32%).
DemographicsRating | RankAssociate's Degree
Cubans
0.6
/100
|
#254
Tragic
41.9%
Immigrants | Guyana
0.5
/100
|
#255
Tragic
41.8%
Immigrants | Congo
0.5
/100
|
#256
Tragic
41.8%
Spanish Americans
0.5
/100
|
#257
Tragic
41.8%
Japanese
0.5
/100
|
#258
Tragic
41.7%
Malaysians
0.4
/100
|
#259
Tragic
41.6%
Marshallese
0.4
/100
|
#260
Tragic
41.6%
Nicaraguans
0.4
/100
|
#261
Tragic
41.5%
Bahamians
0.4
/100
|
#262
Tragic
41.5%
Immigrants | Jamaica
0.3
/100
|
#263
Tragic
41.5%
Osage
0.3
/100
|
#264
Tragic
41.5%
Africans
0.2
/100
|
#265
Tragic
41.1%
Samoans
0.2
/100
|
#266
Tragic
41.1%
Hawaiians
0.2
/100
|
#267
Tragic
40.9%
Central American Indians
0.2
/100
|
#268
Tragic
40.8%