Hungarian vs Immigrants from Middle Africa Associate's Degree

COMPARE

Hungarian
Race
Ancestry
AfghanAfricanAlaska NativeAlaskan AthabascanAlbanianAleutAlsatianAmericanApacheArabArapahoArgentineanArmenianAssyrian/Chaldean/SyriacAustralianAustrianBahamianBangladeshiBarbadianBasqueBelgianBelizeanBermudanBhutaneseBlackfeetBolivianBrazilianBritishBritish West IndianBulgarianBurmeseCajunCambodianCanadianCape VerdeanCarpatho RusynCelticCentral AmericanCentral American IndianCherokeeCheyenneChickasawChileanChineseChippewaChoctawColombianColvilleComancheCosta RicanCreeCreekCroatianCrowCubanCypriotCzechCzechoslovakianDanishDelawareDominicanDutchDutch West IndianEastern EuropeanEcuadorianEgyptianEnglishEstonianEthiopianEuropeanFijianFilipinoFinnishFrenchFrench American IndianFrench CanadianGermanGerman RussianGhanaianGreekGuamanian/ChamorroGuatemalanGuyaneseHaitianHmongHonduranHopiHoumaHungarianIcelanderIndian (Asian)IndonesianInupiatIranianIraqiIrishIroquoisIsraeliItalianJamaicanJapaneseJordanianKenyanKiowaKoreanLaotianLatvianLebaneseLiberianLithuanianLumbeeLuxembourgerMacedonianMalaysianMalteseMarshalleseMenomineeMexicanMexican American IndianMongolianMoroccanNative HawaiianNavajoNepaleseNew ZealanderNicaraguanNigerianNorthern EuropeanNorwegianOkinawanOsageOttawaPaiutePakistaniPalestinianPanamanianParaguayanPennsylvania GermanPeruvianPimaPolishPortuguesePotawatomiPuebloPuerto RicanPuget Sound SalishRomanianRussianSalvadoranSamoanScandinavianScotch-IrishScottishSeminoleSenegaleseSerbianShoshoneSierra LeoneanSiouxSlavicSlovakSloveneSomaliSouth AfricanSouth AmericanSouth American IndianSoviet UnionSpaniardSpanishSpanish AmericanSpanish American IndianSri LankanSubsaharan AfricanSudaneseSwedishSwissSyrianTaiwaneseThaiTlingit-HaidaTohono O'OdhamTonganTrinidadian and TobagonianTsimshianTurkishU.S. Virgin IslanderUgandanUkrainianUruguayanUteVenezuelanVietnameseWelshWest IndianYakamaYaquiYugoslavianYumanYup'ikZimbabwean
Immigration
NonimmigrantsImmigrantsAfghanistanAfricaAlbaniaArgentinaArmeniaAsiaAustraliaAustriaBahamasBangladeshBarbadosBelarusBelgiumBelizeBoliviaBosnia and HerzegovinaBrazilBulgariaBurma/MyanmarCabo VerdeCambodiaCameroonCanadaCaribbeanCentral AmericaChileChinaColombiaCongoCosta RicaCroatiaCubaCzechoslovakiaDenmarkDominicaDominican RepublicEastern AfricaEastern AsiaEastern EuropeEcuadorEgyptEl SalvadorEnglandEritreaEthiopiaEuropeFijiFranceGermanyGhanaGreeceGrenadaGuatemalaGuyanaHaitiHondurasHong KongHungaryIndiaIndonesiaIranIraqIrelandIsraelItalyJamaicaJapanJordanKazakhstanKenyaKoreaKuwaitLaosLatin AmericaLatviaLebanonLiberiaLithuaniaMalaysiaMexicoMicronesiaMoldovaMoroccoNepalNetherlandsNicaraguaNigeriaNorth AmericaNorth MacedoniaNorthern AfricaNorthern EuropeNorwayOceaniaPakistanPanamaPeruPhilippinesPolandPortugalRomaniaRussiaSaudi ArabiaScotlandSenegalSerbiaSierra LeoneSingaporeSomaliaSouth AfricaSouth AmericaSouth Central AsiaSouth Eastern AsiaSouthern EuropeSpainSri LankaSt. Vincent and the GrenadinesSudanSwedenSwitzerlandSyriaTaiwanThailandTrinidad and TobagoTurkeyUgandaUkraineUruguayUzbekistanVenezuelaVietnamWest IndiesWestern AfricaWestern AsiaWestern EuropeYemenZaireZimbabweAzores
Immigrants from Middle Africa
Race
Ancestry
AfghanAfricanAlaska NativeAlaskan AthabascanAlbanianAleutAlsatianAmericanApacheArabArapahoArgentineanArmenianAssyrian/Chaldean/SyriacAustralianAustrianBahamianBangladeshiBarbadianBasqueBelgianBelizeanBermudanBhutaneseBlackfeetBolivianBrazilianBritishBritish West IndianBulgarianBurmeseCajunCambodianCanadianCape VerdeanCarpatho RusynCelticCentral AmericanCentral American IndianCherokeeCheyenneChickasawChileanChineseChippewaChoctawColombianColvilleComancheCosta RicanCreeCreekCroatianCrowCubanCypriotCzechCzechoslovakianDanishDelawareDominicanDutchDutch West IndianEastern EuropeanEcuadorianEgyptianEnglishEstonianEthiopianEuropeanFijianFilipinoFinnishFrenchFrench American IndianFrench CanadianGermanGerman RussianGhanaianGreekGuamanian/ChamorroGuatemalanGuyaneseHaitianHmongHonduranHopiHoumaIcelanderIndian (Asian)IndonesianInupiatIranianIraqiIrishIroquoisIsraeliItalianJamaicanJapaneseJordanianKenyanKiowaKoreanLaotianLatvianLebaneseLiberianLithuanianLumbeeLuxembourgerMacedonianMalaysianMalteseMarshalleseMenomineeMexicanMexican American IndianMongolianMoroccanNative HawaiianNavajoNepaleseNew ZealanderNicaraguanNigerianNorthern EuropeanNorwegianOkinawanOsageOttawaPaiutePakistaniPalestinianPanamanianParaguayanPennsylvania GermanPeruvianPimaPolishPortuguesePotawatomiPuebloPuerto RicanPuget Sound SalishRomanianRussianSalvadoranSamoanScandinavianScotch-IrishScottishSeminoleSenegaleseSerbianShoshoneSierra LeoneanSiouxSlavicSlovakSloveneSomaliSouth AfricanSouth AmericanSouth American IndianSoviet UnionSpaniardSpanishSpanish AmericanSpanish American IndianSri LankanSubsaharan AfricanSudaneseSwedishSwissSyrianTaiwaneseThaiTlingit-HaidaTohono O'OdhamTonganTrinidadian and TobagonianTsimshianTurkishU.S. Virgin IslanderUgandanUkrainianUruguayanUteVenezuelanVietnameseWelshWest IndianYakamaYaquiYugoslavianYumanYup'ikZimbabwean
Immigration
NonimmigrantsImmigrantsAfghanistanAfricaAlbaniaArgentinaArmeniaAsiaAustraliaAustriaBahamasBangladeshBarbadosBelarusBelgiumBelizeBoliviaBosnia and HerzegovinaBrazilBulgariaBurma/MyanmarCabo VerdeCambodiaCameroonCanadaCaribbeanCentral AmericaChileChinaColombiaCongoCosta RicaCroatiaCubaCzechoslovakiaDenmarkDominicaDominican RepublicEastern AfricaEastern AsiaEastern EuropeEcuadorEgyptEl SalvadorEnglandEritreaEthiopiaEuropeFijiFranceGermanyGhanaGreeceGrenadaGuatemalaGuyanaHaitiHondurasHong KongHungaryIndiaIndonesiaIranIraqIrelandIsraelItalyJamaicaJapanJordanKazakhstanKenyaKoreaKuwaitLaosLatin AmericaLatviaLebanonLiberiaLithuaniaMalaysiaMexicoMicronesiaMiddle AfricaMoldovaMoroccoNepalNetherlandsNicaraguaNigeriaNorth AmericaNorth MacedoniaNorthern AfricaNorthern EuropeNorwayOceaniaPakistanPanamaPeruPhilippinesPolandPortugalRomaniaRussiaSaudi ArabiaScotlandSenegalSerbiaSierra LeoneSingaporeSomaliaSouth AfricaSouth AmericaSouth Central AsiaSouth Eastern AsiaSouthern EuropeSpainSri LankaSt. Vincent and the GrenadinesSudanSwedenSwitzerlandSyriaTaiwanThailandTrinidad and TobagoTurkeyUgandaUkraineUruguayUzbekistanVenezuelaVietnamWest IndiesWestern AfricaWestern AsiaWestern EuropeYemenZaireZimbabweAzores
Associate's Degree
Income
Poverty
Unemployment
Labor Participation
Family Structure
Vehicle Availability
Education Level
Disability

Associate's Degree Comparison

Hungarians

Immigrants from Middle Africa

Average
Poor
46.7%
ASSOCIATE'S DEGREE
59.3/ 100
METRIC RATING
166th/ 347
METRIC RANK
44.7%
ASSOCIATE'S DEGREE
12.7/ 100
METRIC RATING
214th/ 347
METRIC RANK

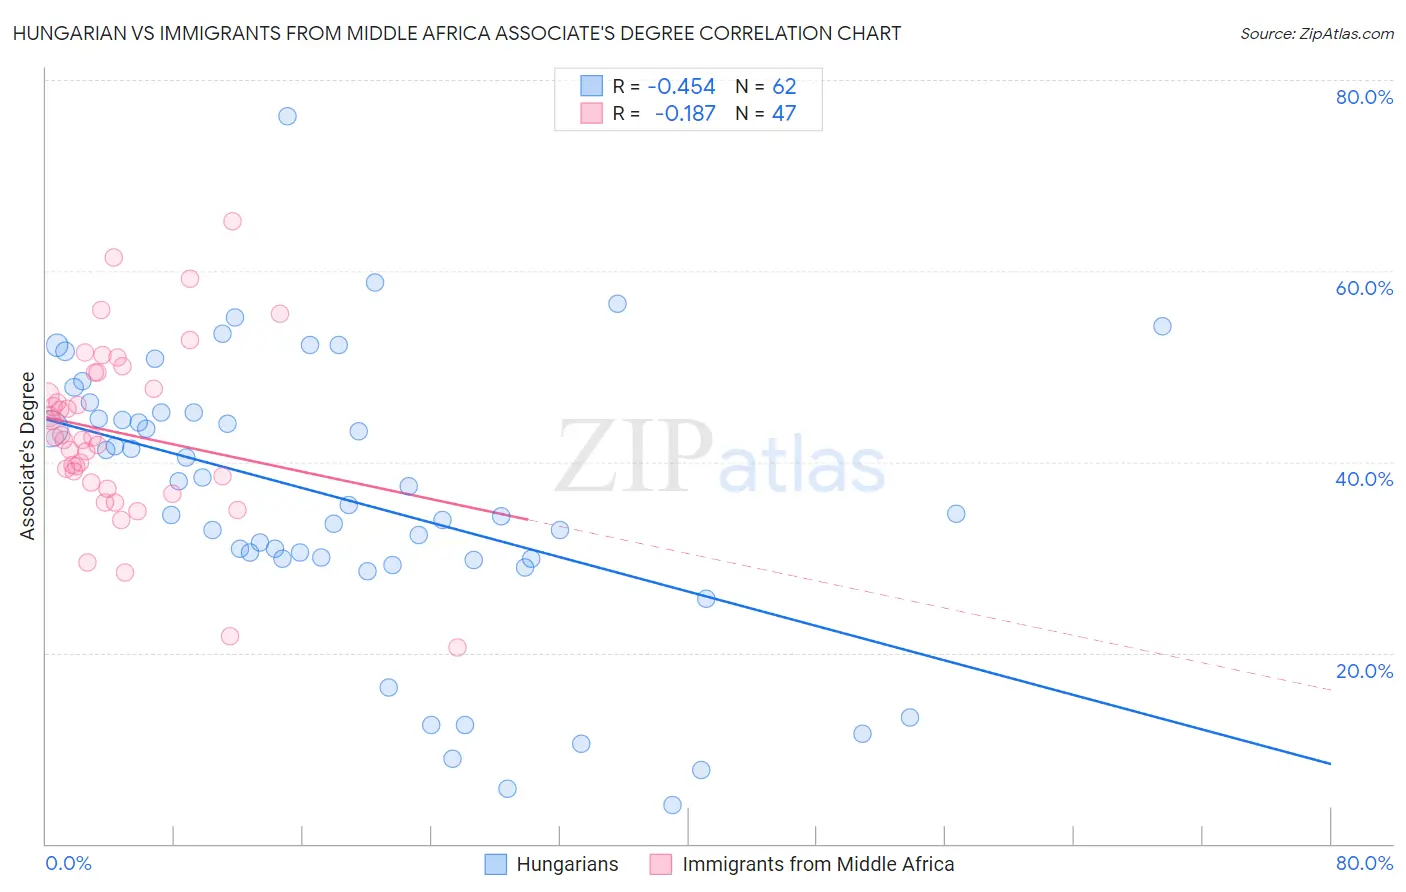
Hungarian vs Immigrants from Middle Africa Associate's Degree Correlation Chart

The statistical analysis conducted on geographies consisting of 486,216,105 people shows a moderate negative correlation between the proportion of Hungarians and percentage of population with at least associate's degree education in the United States with a correlation coefficient (R) of -0.454 and weighted average of 46.7%. Similarly, the statistical analysis conducted on geographies consisting of 202,743,953 people shows a poor negative correlation between the proportion of Immigrants from Middle Africa and percentage of population with at least associate's degree education in the United States with a correlation coefficient (R) of -0.187 and weighted average of 44.7%, a difference of 4.5%.
Hungarian vs Immigrants from Middle Africa Associate's Degree

Associate's Degree Correlation Summary

MeasurementHungarianImmigrants from Middle Africa
Minimum4.0%20.5%
Maximum76.2%65.2%
Range72.2%44.7%
Mean35.9%43.1%
Median35.0%42.6%
Interquartile 25% (IQ1)29.9%37.8%
Interquartile 75% (IQ3)45.2%49.3%
Interquartile Range (IQR)15.3%11.5%
Standard Deviation (Sample)14.7%9.1%
Standard Deviation (Population)14.6%9.0%

Similar Demographics by Associate's Degree

Demographics Similar to Hungarians by Associate's Degree

In terms of associate's degree, the demographic groups most similar to Hungarians are Immigrants from Sierra Leone (46.7%, a difference of 0.010%), Immigrants from South America (46.7%, a difference of 0.040%), Colombian (46.8%, a difference of 0.24%), Somali (46.8%, a difference of 0.25%), and Immigrants from Somalia (46.5%, a difference of 0.29%).
DemographicsRating | RankAssociate's Degree
Immigrants | Poland
69.2
/100
|
#159
Good
47.1%
Scottish
65.4
/100
|
#160
Good
46.9%
Scandinavians
65.2
/100
|
#161
Good
46.9%
Immigrants | Africa
63.2
/100
|
#162
Good
46.8%
Somalis
62.5
/100
|
#163
Good
46.8%
Colombians
62.4
/100
|
#164
Good
46.8%
Immigrants | South America
59.9
/100
|
#165
Average
46.7%
Hungarians
59.3
/100
|
#166
Average
46.7%
Immigrants | Sierra Leone
59.2
/100
|
#167
Average
46.7%
Immigrants | Somalia
55.5
/100
|
#168
Average
46.5%
Uruguayans
55.4
/100
|
#169
Average
46.5%
Irish
53.6
/100
|
#170
Average
46.5%
Basques
52.8
/100
|
#171
Average
46.5%
Peruvians
50.5
/100
|
#172
Average
46.4%
Immigrants | Iraq
50.3
/100
|
#173
Average
46.4%

Demographics Similar to Immigrants from Middle Africa by Associate's Degree

In terms of associate's degree, the demographic groups most similar to Immigrants from Middle Africa are Immigrants from Panama (44.7%, a difference of 0.060%), Immigrants from Nigeria (44.6%, a difference of 0.24%), Immigrants from Ghana (44.8%, a difference of 0.25%), French Canadian (44.9%, a difference of 0.38%), and Immigrants (44.5%, a difference of 0.42%).
DemographicsRating | RankAssociate's Degree
Panamanians
18.4
/100
|
#207
Poor
45.1%
Dutch
17.6
/100
|
#208
Poor
45.0%
Immigrants | Costa Rica
16.7
/100
|
#209
Poor
45.0%
Immigrants | Philippines
16.7
/100
|
#210
Poor
45.0%
Immigrants | Zaire
16.6
/100
|
#211
Poor
45.0%
French Canadians
15.0
/100
|
#212
Poor
44.9%
Immigrants | Ghana
14.2
/100
|
#213
Poor
44.8%
Immigrants | Middle Africa
12.7
/100
|
#214
Poor
44.7%
Immigrants | Panama
12.4
/100
|
#215
Poor
44.7%
Immigrants | Nigeria
11.4
/100
|
#216
Poor
44.6%
Immigrants | Immigrants
10.5
/100
|
#217
Poor
44.5%
Spanish
9.4
/100
|
#218
Tragic
44.4%
Whites/Caucasians
7.5
/100
|
#219
Tragic
44.2%
Portuguese
7.2
/100
|
#220
Tragic
44.1%
Immigrants | Western Africa
6.6
/100
|
#221
Tragic
44.1%