Houma vs West Indian Nursery School
COMPARE
Houma
West Indian
Nursery School
Nursery School Comparison
Houma
West Indians
97.3%
NURSERY SCHOOL
0.0/ 100
METRIC RATING
292nd/ 347
METRIC RANK
97.5%
NURSERY SCHOOL
0.3/ 100
METRIC RATING
268th/ 347
METRIC RANK
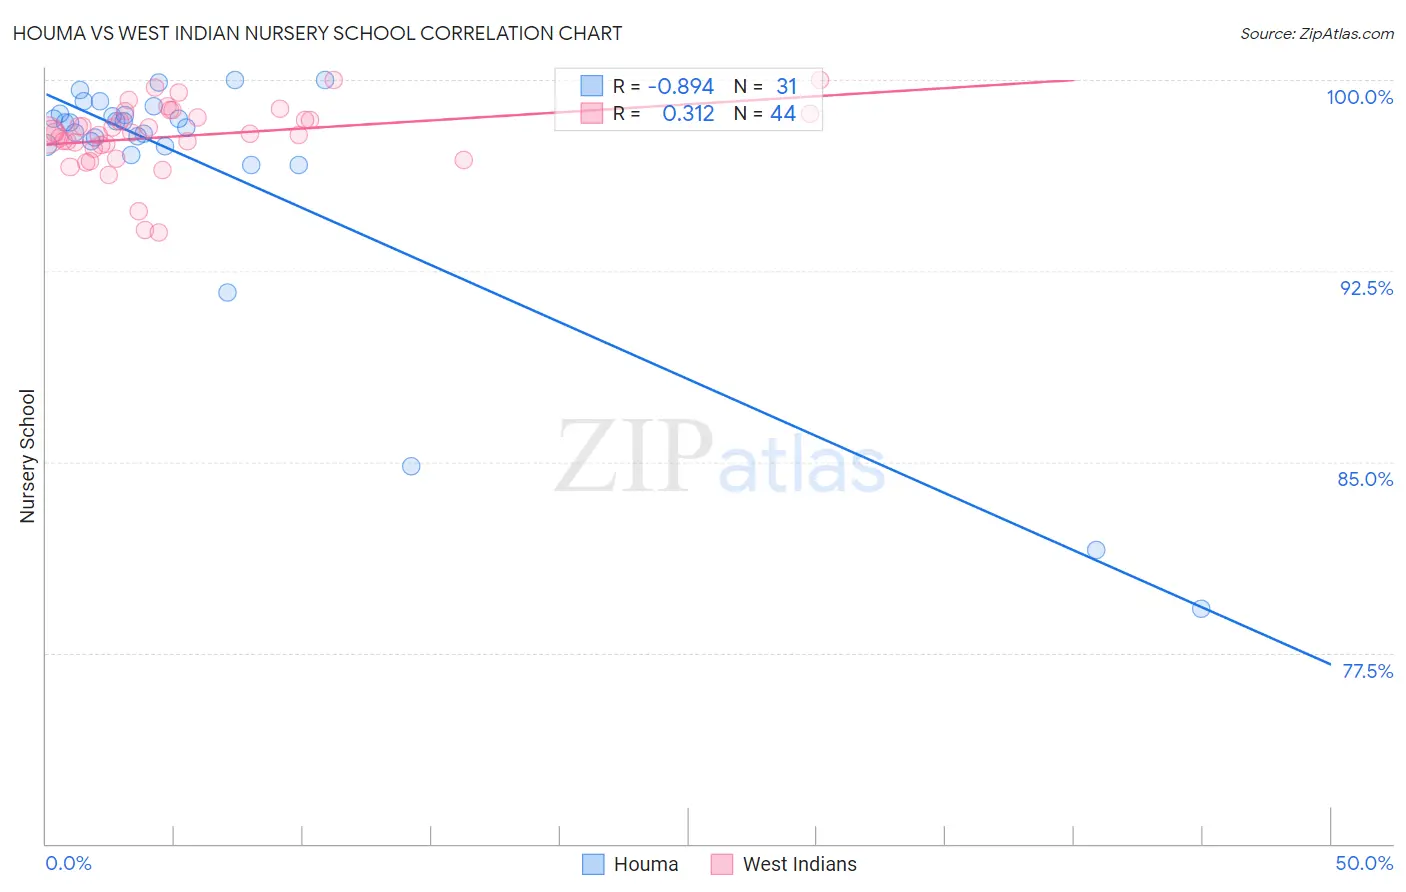
Houma vs West Indian Nursery School Correlation Chart
The statistical analysis conducted on geographies consisting of 36,795,916 people shows a very strong negative correlation between the proportion of Houma and percentage of population with at least nursery school education in the United States with a correlation coefficient (R) of -0.894 and weighted average of 97.3%. Similarly, the statistical analysis conducted on geographies consisting of 254,063,654 people shows a mild positive correlation between the proportion of West Indians and percentage of population with at least nursery school education in the United States with a correlation coefficient (R) of 0.312 and weighted average of 97.5%, a difference of 0.28%.
Nursery School Correlation Summary
| Measurement | Houma | West Indian |
| Minimum | 79.2% | 94.0% |
| Maximum | 100.0% | 100.0% |
| Range | 20.8% | 6.0% |
| Mean | 96.5% | 97.8% |
| Median | 98.3% | 97.9% |
| Interquartile 25% (IQ1) | 97.4% | 97.4% |
| Interquartile 75% (IQ3) | 98.7% | 98.6% |
| Interquartile Range (IQR) | 1.3% | 1.2% |
| Standard Deviation (Sample) | 5.2% | 1.3% |
| Standard Deviation (Population) | 5.1% | 1.3% |
Similar Demographics by Nursery School
Demographics Similar to Houma by Nursery School
In terms of nursery school, the demographic groups most similar to Houma are Malaysian (97.3%, a difference of 0.010%), British West Indian (97.3%, a difference of 0.020%), Immigrants from Grenada (97.3%, a difference of 0.020%), Immigrants (97.2%, a difference of 0.030%), and Immigrants from Eritrea (97.2%, a difference of 0.040%).
| Demographics | Rating | Rank | Nursery School |
| Immigrants | Barbados | 0.0 /100 | #285 | Tragic 97.4% |
| Immigrants | Portugal | 0.0 /100 | #286 | Tragic 97.4% |
| Immigrants | Hong Kong | 0.0 /100 | #287 | Tragic 97.4% |
| Immigrants | Thailand | 0.0 /100 | #288 | Tragic 97.3% |
| Immigrants | St. Vincent and the Grenadines | 0.0 /100 | #289 | Tragic 97.3% |
| Immigrants | Afghanistan | 0.0 /100 | #290 | Tragic 97.3% |
| British West Indians | 0.0 /100 | #291 | Tragic 97.3% |
| Houma | 0.0 /100 | #292 | Tragic 97.3% |
| Malaysians | 0.0 /100 | #293 | Tragic 97.3% |
| Immigrants | Grenada | 0.0 /100 | #294 | Tragic 97.3% |
| Immigrants | Immigrants | 0.0 /100 | #295 | Tragic 97.2% |
| Immigrants | Eritrea | 0.0 /100 | #296 | Tragic 97.2% |
| Immigrants | Cuba | 0.0 /100 | #297 | Tragic 97.2% |
| Central American Indians | 0.0 /100 | #298 | Tragic 97.2% |
| Immigrants | Dominica | 0.0 /100 | #299 | Tragic 97.2% |
Demographics Similar to West Indians by Nursery School
In terms of nursery school, the demographic groups most similar to West Indians are Immigrants from Nigeria (97.5%, a difference of 0.0%), Immigrants from Liberia (97.5%, a difference of 0.0%), Immigrants from Sierra Leone (97.6%, a difference of 0.010%), Immigrants from Jamaica (97.5%, a difference of 0.010%), and Fijian (97.6%, a difference of 0.020%).
| Demographics | Rating | Rank | Nursery School |
| Cubans | 0.4 /100 | #261 | Tragic 97.6% |
| Immigrants | Ethiopia | 0.4 /100 | #262 | Tragic 97.6% |
| Fijians | 0.3 /100 | #263 | Tragic 97.6% |
| Taiwanese | 0.3 /100 | #264 | Tragic 97.6% |
| Assyrians/Chaldeans/Syriacs | 0.3 /100 | #265 | Tragic 97.6% |
| Immigrants | Sierra Leone | 0.3 /100 | #266 | Tragic 97.6% |
| Immigrants | Nigeria | 0.3 /100 | #267 | Tragic 97.5% |
| West Indians | 0.3 /100 | #268 | Tragic 97.5% |
| Immigrants | Liberia | 0.3 /100 | #269 | Tragic 97.5% |
| Immigrants | Jamaica | 0.2 /100 | #270 | Tragic 97.5% |
| Immigrants | Peru | 0.2 /100 | #271 | Tragic 97.5% |
| Immigrants | Bolivia | 0.1 /100 | #272 | Tragic 97.5% |
| Immigrants | China | 0.1 /100 | #273 | Tragic 97.5% |
| Immigrants | Cameroon | 0.1 /100 | #274 | Tragic 97.5% |
| Ghanaians | 0.1 /100 | #275 | Tragic 97.5% |