Houma vs New Zealander Bachelor's Degree
COMPARE
Houma
New Zealander
Bachelor's Degree
Bachelor's Degree Comparison
Houma
New Zealanders
21.4%
BACHELOR'S DEGREE
0.0/ 100
METRIC RATING
346th/ 347
METRIC RANK
44.0%
BACHELOR'S DEGREE
99.9/ 100
METRIC RATING
60th/ 347
METRIC RANK
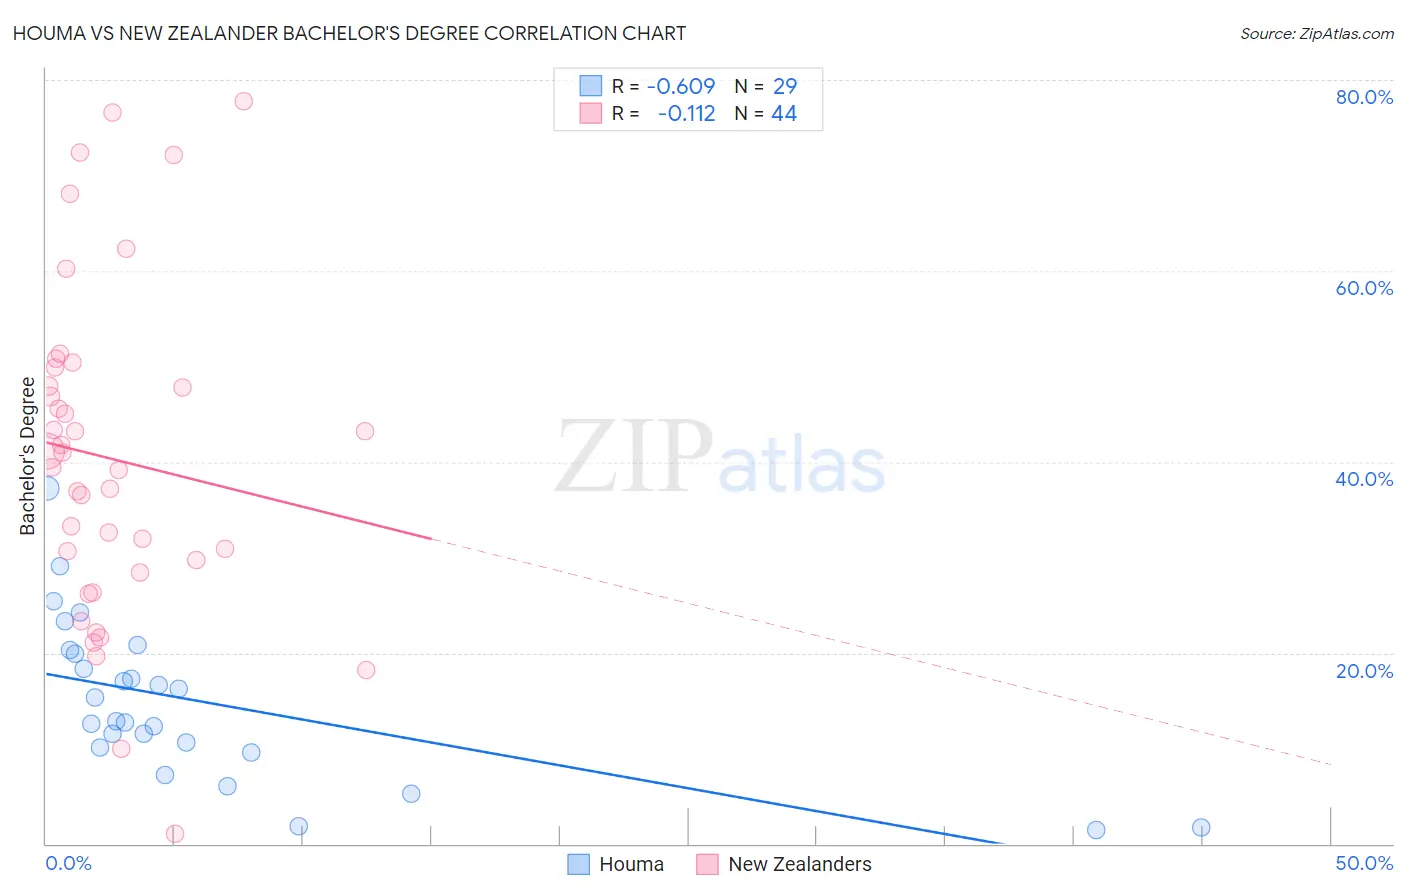
Houma vs New Zealander Bachelor's Degree Correlation Chart
The statistical analysis conducted on geographies consisting of 36,792,534 people shows a significant negative correlation between the proportion of Houma and percentage of population with at least bachelor's degree education in the United States with a correlation coefficient (R) of -0.609 and weighted average of 21.4%. Similarly, the statistical analysis conducted on geographies consisting of 106,915,831 people shows a poor negative correlation between the proportion of New Zealanders and percentage of population with at least bachelor's degree education in the United States with a correlation coefficient (R) of -0.112 and weighted average of 44.0%, a difference of 105.2%.
Bachelor's Degree Correlation Summary
| Measurement | Houma | New Zealander |
| Minimum | 1.5% | 1.0% |
| Maximum | 37.2% | 77.8% |
| Range | 35.8% | 76.8% |
| Mean | 14.8% | 40.3% |
| Median | 12.8% | 40.2% |
| Interquartile 25% (IQ1) | 9.8% | 29.1% |
| Interquartile 75% (IQ3) | 20.1% | 48.9% |
| Interquartile Range (IQR) | 10.3% | 19.8% |
| Standard Deviation (Sample) | 8.4% | 17.3% |
| Standard Deviation (Population) | 8.2% | 17.1% |
Similar Demographics by Bachelor's Degree
Demographics Similar to Houma by Bachelor's Degree
In terms of bachelor's degree, the demographic groups most similar to Houma are Pima (23.2%, a difference of 8.3%), Navajo (23.6%, a difference of 10.2%), Yup'ik (19.4%, a difference of 10.4%), Tohono O'odham (24.4%, a difference of 14.0%), and Yakama (24.5%, a difference of 14.2%).
| Demographics | Rating | Rank | Bachelor's Degree |
| Mexicans | 0.0 /100 | #333 | Tragic 27.1% |
| Arapaho | 0.0 /100 | #334 | Tragic 26.6% |
| Natives/Alaskans | 0.0 /100 | #335 | Tragic 26.3% |
| Immigrants | Mexico | 0.0 /100 | #336 | Tragic 26.1% |
| Inupiat | 0.0 /100 | #337 | Tragic 25.8% |
| Pueblo | 0.0 /100 | #338 | Tragic 25.5% |
| Hopi | 0.0 /100 | #339 | Tragic 25.3% |
| Lumbee | 0.0 /100 | #340 | Tragic 24.8% |
| Yuman | 0.0 /100 | #341 | Tragic 24.5% |
| Yakama | 0.0 /100 | #342 | Tragic 24.5% |
| Tohono O'odham | 0.0 /100 | #343 | Tragic 24.4% |
| Navajo | 0.0 /100 | #344 | Tragic 23.6% |
| Pima | 0.0 /100 | #345 | Tragic 23.2% |
| Houma | 0.0 /100 | #346 | Tragic 21.4% |
| Yup'ik | 0.0 /100 | #347 | Tragic 19.4% |
Demographics Similar to New Zealanders by Bachelor's Degree
In terms of bachelor's degree, the demographic groups most similar to New Zealanders are Australian (44.0%, a difference of 0.010%), Immigrants from Czechoslovakia (44.0%, a difference of 0.11%), Paraguayan (44.0%, a difference of 0.16%), Immigrants from Serbia (44.1%, a difference of 0.35%), and Immigrants from Bolivia (44.2%, a difference of 0.53%).
| Demographics | Rating | Rank | Bachelor's Degree |
| Immigrants | Asia | 99.9 /100 | #53 | Exceptional 44.3% |
| Immigrants | Austria | 99.9 /100 | #54 | Exceptional 44.2% |
| Immigrants | Bolivia | 99.9 /100 | #55 | Exceptional 44.2% |
| Immigrants | Serbia | 99.9 /100 | #56 | Exceptional 44.1% |
| Paraguayans | 99.9 /100 | #57 | Exceptional 44.0% |
| Immigrants | Czechoslovakia | 99.9 /100 | #58 | Exceptional 44.0% |
| Australians | 99.9 /100 | #59 | Exceptional 44.0% |
| New Zealanders | 99.9 /100 | #60 | Exceptional 44.0% |
| South Africans | 99.8 /100 | #61 | Exceptional 43.6% |
| Immigrants | Kazakhstan | 99.8 /100 | #62 | Exceptional 43.4% |
| Immigrants | Europe | 99.8 /100 | #63 | Exceptional 43.4% |
| Argentineans | 99.7 /100 | #64 | Exceptional 43.3% |
| Zimbabweans | 99.7 /100 | #65 | Exceptional 43.3% |
| Immigrants | Netherlands | 99.7 /100 | #66 | Exceptional 43.3% |
| Egyptians | 99.7 /100 | #67 | Exceptional 43.3% |