Houma vs Immigrants from Venezuela Bachelor's Degree
COMPARE
Houma
Immigrants from Venezuela
Bachelor's Degree
Bachelor's Degree Comparison
Houma
Immigrants from Venezuela
21.4%
BACHELOR'S DEGREE
0.0/ 100
METRIC RATING
346th/ 347
METRIC RANK
40.2%
BACHELOR'S DEGREE
92.9/ 100
METRIC RATING
128th/ 347
METRIC RANK
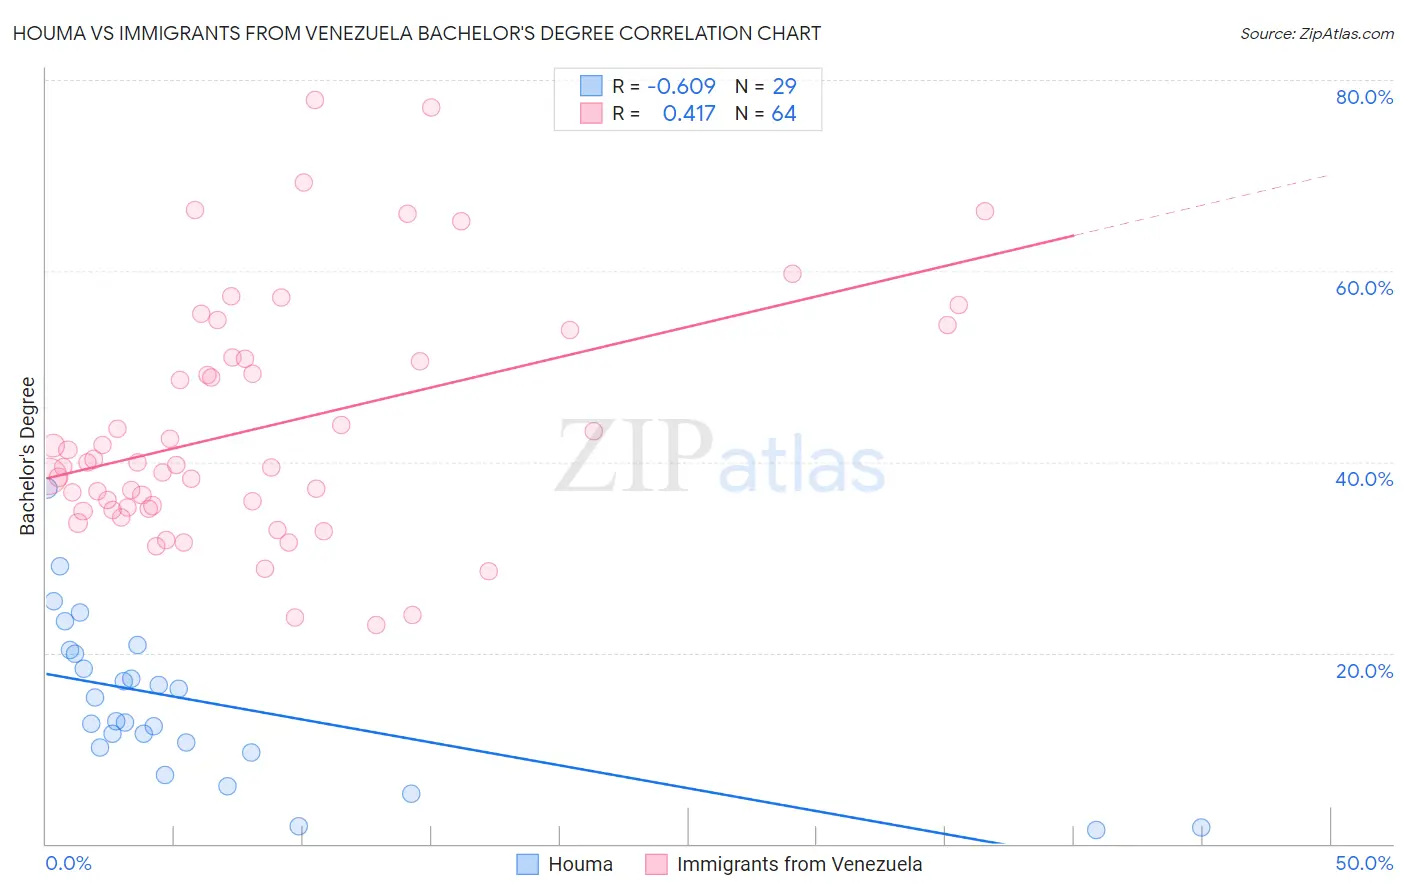
Houma vs Immigrants from Venezuela Bachelor's Degree Correlation Chart
The statistical analysis conducted on geographies consisting of 36,792,534 people shows a significant negative correlation between the proportion of Houma and percentage of population with at least bachelor's degree education in the United States with a correlation coefficient (R) of -0.609 and weighted average of 21.4%. Similarly, the statistical analysis conducted on geographies consisting of 287,853,697 people shows a moderate positive correlation between the proportion of Immigrants from Venezuela and percentage of population with at least bachelor's degree education in the United States with a correlation coefficient (R) of 0.417 and weighted average of 40.2%, a difference of 87.6%.
Bachelor's Degree Correlation Summary
| Measurement | Houma | Immigrants from Venezuela |
| Minimum | 1.5% | 22.9% |
| Maximum | 37.2% | 77.9% |
| Range | 35.8% | 55.1% |
| Mean | 14.8% | 43.7% |
| Median | 12.8% | 39.8% |
| Interquartile 25% (IQ1) | 9.8% | 35.2% |
| Interquartile 75% (IQ3) | 20.1% | 50.9% |
| Interquartile Range (IQR) | 10.3% | 15.7% |
| Standard Deviation (Sample) | 8.4% | 12.7% |
| Standard Deviation (Population) | 8.2% | 12.6% |
Similar Demographics by Bachelor's Degree
Demographics Similar to Houma by Bachelor's Degree
In terms of bachelor's degree, the demographic groups most similar to Houma are Pima (23.2%, a difference of 8.3%), Navajo (23.6%, a difference of 10.2%), Yup'ik (19.4%, a difference of 10.4%), Tohono O'odham (24.4%, a difference of 14.0%), and Yakama (24.5%, a difference of 14.2%).
| Demographics | Rating | Rank | Bachelor's Degree |
| Mexicans | 0.0 /100 | #333 | Tragic 27.1% |
| Arapaho | 0.0 /100 | #334 | Tragic 26.6% |
| Natives/Alaskans | 0.0 /100 | #335 | Tragic 26.3% |
| Immigrants | Mexico | 0.0 /100 | #336 | Tragic 26.1% |
| Inupiat | 0.0 /100 | #337 | Tragic 25.8% |
| Pueblo | 0.0 /100 | #338 | Tragic 25.5% |
| Hopi | 0.0 /100 | #339 | Tragic 25.3% |
| Lumbee | 0.0 /100 | #340 | Tragic 24.8% |
| Yuman | 0.0 /100 | #341 | Tragic 24.5% |
| Yakama | 0.0 /100 | #342 | Tragic 24.5% |
| Tohono O'odham | 0.0 /100 | #343 | Tragic 24.4% |
| Navajo | 0.0 /100 | #344 | Tragic 23.6% |
| Pima | 0.0 /100 | #345 | Tragic 23.2% |
| Houma | 0.0 /100 | #346 | Tragic 21.4% |
| Yup'ik | 0.0 /100 | #347 | Tragic 19.4% |
Demographics Similar to Immigrants from Venezuela by Bachelor's Degree
In terms of bachelor's degree, the demographic groups most similar to Immigrants from Venezuela are Immigrants from Jordan (40.3%, a difference of 0.17%), Serbian (40.1%, a difference of 0.17%), Sierra Leonean (40.1%, a difference of 0.24%), Italian (40.1%, a difference of 0.32%), and Immigrants from Eastern Africa (40.4%, a difference of 0.46%).
| Demographics | Rating | Rank | Bachelor's Degree |
| Moroccans | 94.6 /100 | #121 | Exceptional 40.5% |
| Immigrants | Albania | 94.4 /100 | #122 | Exceptional 40.4% |
| Lebanese | 94.3 /100 | #123 | Exceptional 40.4% |
| Immigrants | Eritrea | 94.3 /100 | #124 | Exceptional 40.4% |
| British | 94.2 /100 | #125 | Exceptional 40.4% |
| Immigrants | Eastern Africa | 94.1 /100 | #126 | Exceptional 40.4% |
| Immigrants | Jordan | 93.4 /100 | #127 | Exceptional 40.3% |
| Immigrants | Venezuela | 92.9 /100 | #128 | Exceptional 40.2% |
| Serbians | 92.4 /100 | #129 | Exceptional 40.1% |
| Sierra Leoneans | 92.2 /100 | #130 | Exceptional 40.1% |
| Italians | 91.9 /100 | #131 | Exceptional 40.1% |
| Taiwanese | 91.1 /100 | #132 | Exceptional 40.0% |
| Immigrants | Southern Europe | 91.1 /100 | #133 | Exceptional 40.0% |
| Assyrians/Chaldeans/Syriacs | 89.4 /100 | #134 | Excellent 39.8% |
| Luxembourgers | 89.1 /100 | #135 | Excellent 39.8% |