Honduran vs Serbian Doctorate Degree
COMPARE
Honduran
Serbian
Doctorate Degree
Doctorate Degree Comparison
Hondurans
Serbians
1.4%
DOCTORATE DEGREE
0.1/ 100
METRIC RATING
301st/ 347
METRIC RANK
2.0%
DOCTORATE DEGREE
88.7/ 100
METRIC RATING
135th/ 347
METRIC RANK
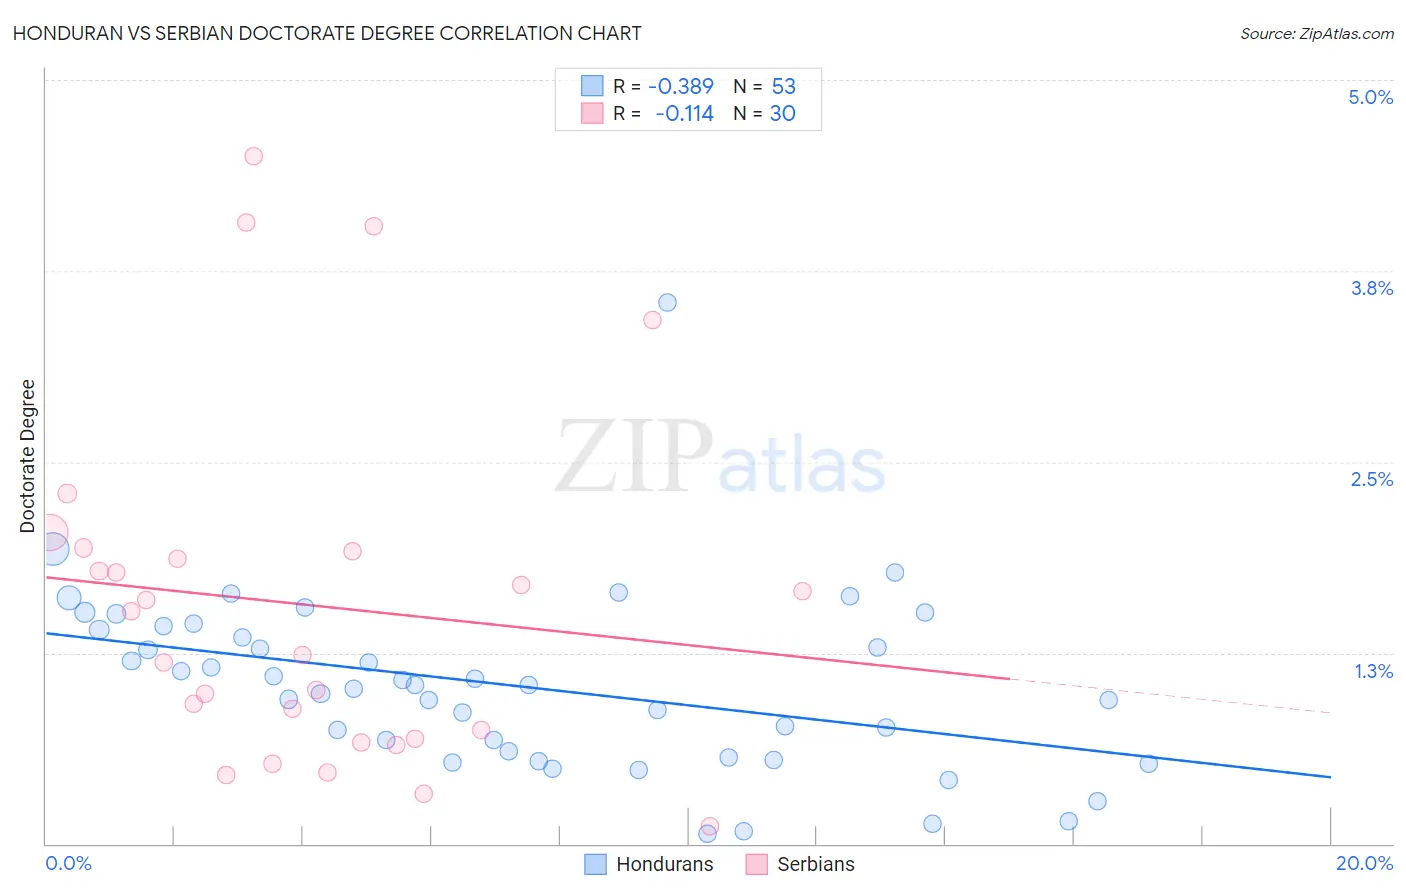
Honduran vs Serbian Doctorate Degree Correlation Chart
The statistical analysis conducted on geographies consisting of 353,493,609 people shows a mild negative correlation between the proportion of Hondurans and percentage of population with at least doctorate degree education in the United States with a correlation coefficient (R) of -0.389 and weighted average of 1.4%. Similarly, the statistical analysis conducted on geographies consisting of 265,941,382 people shows a poor negative correlation between the proportion of Serbians and percentage of population with at least doctorate degree education in the United States with a correlation coefficient (R) of -0.114 and weighted average of 2.0%, a difference of 42.5%.
Doctorate Degree Correlation Summary
| Measurement | Honduran | Serbian |
| Minimum | 0.068% | 0.11% |
| Maximum | 3.5% | 4.5% |
| Range | 3.5% | 4.4% |
| Mean | 1.0% | 1.6% |
| Median | 1.0% | 1.4% |
| Interquartile 25% (IQ1) | 0.59% | 0.69% |
| Interquartile 75% (IQ3) | 1.4% | 1.9% |
| Interquartile Range (IQR) | 0.82% | 1.2% |
| Standard Deviation (Sample) | 0.59% | 1.1% |
| Standard Deviation (Population) | 0.58% | 1.1% |
Similar Demographics by Doctorate Degree
Demographics Similar to Hondurans by Doctorate Degree
In terms of doctorate degree, the demographic groups most similar to Hondurans are Immigrants from Guatemala (1.4%, a difference of 0.070%), Shoshone (1.4%, a difference of 0.33%), Immigrants from Dominica (1.4%, a difference of 0.36%), Belizean (1.4%, a difference of 0.40%), and Mexican American Indian (1.4%, a difference of 0.42%).
| Demographics | Rating | Rank | Doctorate Degree |
| Samoans | 0.2 /100 | #294 | Tragic 1.4% |
| Guatemalans | 0.2 /100 | #295 | Tragic 1.4% |
| Immigrants | Ecuador | 0.2 /100 | #296 | Tragic 1.4% |
| Tsimshian | 0.2 /100 | #297 | Tragic 1.4% |
| Puerto Ricans | 0.1 /100 | #298 | Tragic 1.4% |
| Belizeans | 0.1 /100 | #299 | Tragic 1.4% |
| Immigrants | Guatemala | 0.1 /100 | #300 | Tragic 1.4% |
| Hondurans | 0.1 /100 | #301 | Tragic 1.4% |
| Shoshone | 0.1 /100 | #302 | Tragic 1.4% |
| Immigrants | Dominica | 0.1 /100 | #303 | Tragic 1.4% |
| Mexican American Indians | 0.1 /100 | #304 | Tragic 1.4% |
| Pennsylvania Germans | 0.1 /100 | #305 | Tragic 1.4% |
| Guyanese | 0.1 /100 | #306 | Tragic 1.4% |
| Cubans | 0.1 /100 | #307 | Tragic 1.4% |
| Immigrants | Laos | 0.1 /100 | #308 | Tragic 1.4% |
Demographics Similar to Serbians by Doctorate Degree
In terms of doctorate degree, the demographic groups most similar to Serbians are Immigrants from Cameroon (2.0%, a difference of 0.060%), Swedish (2.0%, a difference of 0.14%), South American Indian (2.0%, a difference of 0.15%), Immigrants from Uzbekistan (2.0%, a difference of 0.21%), and Swiss (2.0%, a difference of 0.24%).
| Demographics | Rating | Rank | Doctorate Degree |
| Immigrants | Zaire | 91.1 /100 | #128 | Exceptional 2.0% |
| Canadians | 90.6 /100 | #129 | Exceptional 2.0% |
| Immigrants | Ukraine | 90.5 /100 | #130 | Exceptional 2.0% |
| Immigrants | Sierra Leone | 90.2 /100 | #131 | Exceptional 2.0% |
| Scottish | 89.4 /100 | #132 | Excellent 2.0% |
| Immigrants | Uzbekistan | 89.3 /100 | #133 | Excellent 2.0% |
| Immigrants | Cameroon | 88.9 /100 | #134 | Excellent 2.0% |
| Serbians | 88.7 /100 | #135 | Excellent 2.0% |
| Swedes | 88.3 /100 | #136 | Excellent 2.0% |
| South American Indians | 88.3 /100 | #137 | Excellent 2.0% |
| Swiss | 88.0 /100 | #138 | Excellent 2.0% |
| Afghans | 87.2 /100 | #139 | Excellent 2.0% |
| Immigrants | Africa | 87.0 /100 | #140 | Excellent 2.0% |
| Senegalese | 86.7 /100 | #141 | Excellent 2.0% |
| Italians | 86.0 /100 | #142 | Excellent 2.0% |