Honduran vs Immigrants from Asia Doctorate Degree
COMPARE
Honduran
Immigrants from Asia
Doctorate Degree
Doctorate Degree Comparison
Hondurans
Immigrants from Asia
1.4%
DOCTORATE DEGREE
0.1/ 100
METRIC RATING
301st/ 347
METRIC RANK
2.4%
DOCTORATE DEGREE
100.0/ 100
METRIC RATING
49th/ 347
METRIC RANK
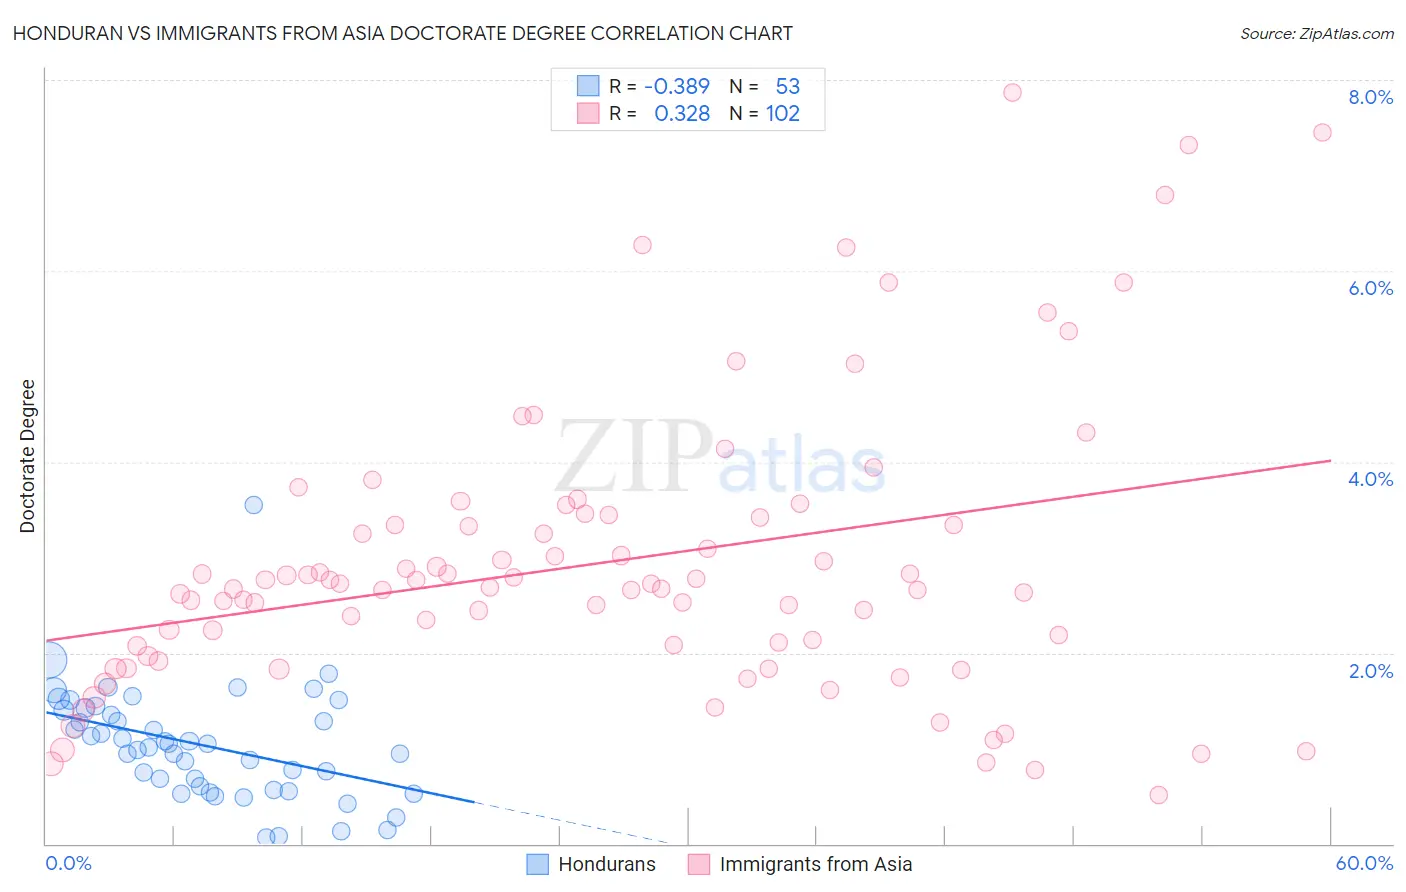
Honduran vs Immigrants from Asia Doctorate Degree Correlation Chart
The statistical analysis conducted on geographies consisting of 353,493,609 people shows a mild negative correlation between the proportion of Hondurans and percentage of population with at least doctorate degree education in the United States with a correlation coefficient (R) of -0.389 and weighted average of 1.4%. Similarly, the statistical analysis conducted on geographies consisting of 533,403,409 people shows a mild positive correlation between the proportion of Immigrants from Asia and percentage of population with at least doctorate degree education in the United States with a correlation coefficient (R) of 0.328 and weighted average of 2.4%, a difference of 74.8%.
Doctorate Degree Correlation Summary
| Measurement | Honduran | Immigrants from Asia |
| Minimum | 0.068% | 0.51% |
| Maximum | 3.5% | 7.9% |
| Range | 3.5% | 7.4% |
| Mean | 1.0% | 2.9% |
| Median | 1.0% | 2.7% |
| Interquartile 25% (IQ1) | 0.59% | 2.1% |
| Interquartile 75% (IQ3) | 1.4% | 3.4% |
| Interquartile Range (IQR) | 0.82% | 1.3% |
| Standard Deviation (Sample) | 0.59% | 1.5% |
| Standard Deviation (Population) | 0.58% | 1.5% |
Similar Demographics by Doctorate Degree
Demographics Similar to Hondurans by Doctorate Degree
In terms of doctorate degree, the demographic groups most similar to Hondurans are Immigrants from Guatemala (1.4%, a difference of 0.070%), Shoshone (1.4%, a difference of 0.33%), Immigrants from Dominica (1.4%, a difference of 0.36%), Belizean (1.4%, a difference of 0.40%), and Mexican American Indian (1.4%, a difference of 0.42%).
| Demographics | Rating | Rank | Doctorate Degree |
| Samoans | 0.2 /100 | #294 | Tragic 1.4% |
| Guatemalans | 0.2 /100 | #295 | Tragic 1.4% |
| Immigrants | Ecuador | 0.2 /100 | #296 | Tragic 1.4% |
| Tsimshian | 0.2 /100 | #297 | Tragic 1.4% |
| Puerto Ricans | 0.1 /100 | #298 | Tragic 1.4% |
| Belizeans | 0.1 /100 | #299 | Tragic 1.4% |
| Immigrants | Guatemala | 0.1 /100 | #300 | Tragic 1.4% |
| Hondurans | 0.1 /100 | #301 | Tragic 1.4% |
| Shoshone | 0.1 /100 | #302 | Tragic 1.4% |
| Immigrants | Dominica | 0.1 /100 | #303 | Tragic 1.4% |
| Mexican American Indians | 0.1 /100 | #304 | Tragic 1.4% |
| Pennsylvania Germans | 0.1 /100 | #305 | Tragic 1.4% |
| Guyanese | 0.1 /100 | #306 | Tragic 1.4% |
| Cubans | 0.1 /100 | #307 | Tragic 1.4% |
| Immigrants | Laos | 0.1 /100 | #308 | Tragic 1.4% |
Demographics Similar to Immigrants from Asia by Doctorate Degree
In terms of doctorate degree, the demographic groups most similar to Immigrants from Asia are Asian (2.4%, a difference of 0.13%), Immigrants from Western Europe (2.4%, a difference of 0.34%), Immigrants from Austria (2.4%, a difference of 0.57%), Immigrants from South Africa (2.4%, a difference of 0.70%), and Immigrants from Norway (2.4%, a difference of 1.1%).
| Demographics | Rating | Rank | Doctorate Degree |
| New Zealanders | 100.0 /100 | #42 | Exceptional 2.5% |
| Soviet Union | 100.0 /100 | #43 | Exceptional 2.5% |
| Immigrants | Netherlands | 100.0 /100 | #44 | Exceptional 2.5% |
| Immigrants | South Africa | 100.0 /100 | #45 | Exceptional 2.4% |
| Immigrants | Austria | 100.0 /100 | #46 | Exceptional 2.4% |
| Immigrants | Western Europe | 100.0 /100 | #47 | Exceptional 2.4% |
| Asians | 100.0 /100 | #48 | Exceptional 2.4% |
| Immigrants | Asia | 100.0 /100 | #49 | Exceptional 2.4% |
| Immigrants | Norway | 100.0 /100 | #50 | Exceptional 2.4% |
| Australians | 100.0 /100 | #51 | Exceptional 2.4% |
| Bulgarians | 100.0 /100 | #52 | Exceptional 2.4% |
| Immigrants | Latvia | 100.0 /100 | #53 | Exceptional 2.4% |
| Immigrants | Indonesia | 100.0 /100 | #54 | Exceptional 2.4% |
| Bolivians | 100.0 /100 | #55 | Exceptional 2.4% |
| Immigrants | Czechoslovakia | 100.0 /100 | #56 | Exceptional 2.4% |