Hmong vs Immigrants from Zimbabwe No Schooling Completed
COMPARE
Hmong
Immigrants from Zimbabwe
No Schooling Completed
No Schooling Completed Comparison
Hmong
Immigrants from Zimbabwe
1.9%
NO SCHOOLING COMPLETED
88.5/ 100
METRIC RATING
135th/ 347
METRIC RANK
1.9%
NO SCHOOLING COMPLETED
96.2/ 100
METRIC RATING
113th/ 347
METRIC RANK
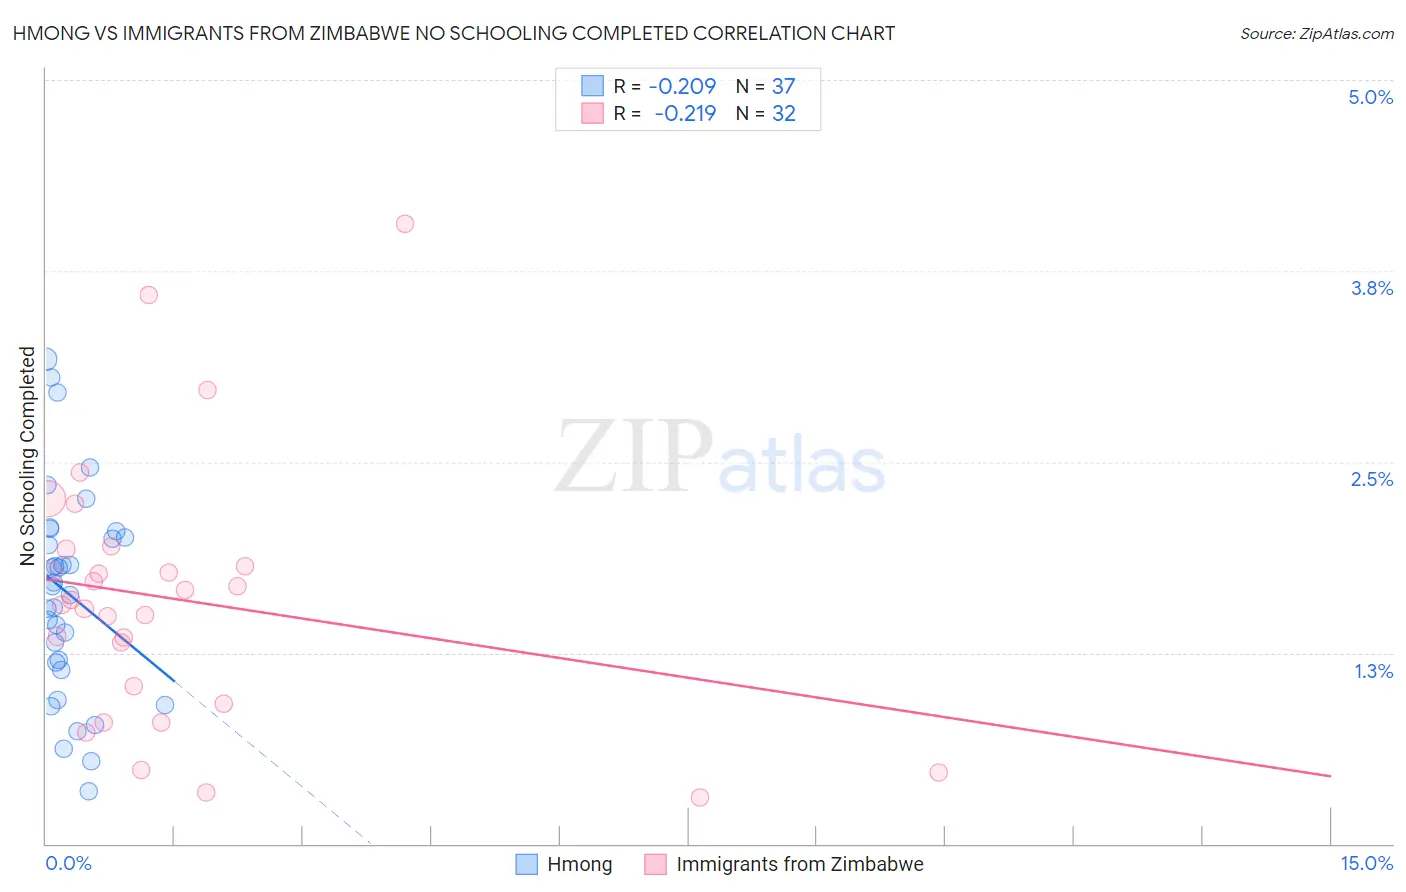
Hmong vs Immigrants from Zimbabwe No Schooling Completed Correlation Chart
The statistical analysis conducted on geographies consisting of 24,657,468 people shows a weak negative correlation between the proportion of Hmong and percentage of population with no schooling in the United States with a correlation coefficient (R) of -0.209 and weighted average of 1.9%. Similarly, the statistical analysis conducted on geographies consisting of 117,317,666 people shows a weak negative correlation between the proportion of Immigrants from Zimbabwe and percentage of population with no schooling in the United States with a correlation coefficient (R) of -0.219 and weighted average of 1.9%, a difference of 4.4%.
No Schooling Completed Correlation Summary
| Measurement | Hmong | Immigrants from Zimbabwe |
| Minimum | 0.34% | 0.31% |
| Maximum | 3.2% | 4.1% |
| Range | 2.8% | 3.8% |
| Mean | 1.6% | 1.6% |
| Median | 1.7% | 1.6% |
| Interquartile 25% (IQ1) | 1.2% | 0.97% |
| Interquartile 75% (IQ3) | 2.0% | 1.9% |
| Interquartile Range (IQR) | 0.86% | 0.90% |
| Standard Deviation (Sample) | 0.68% | 0.86% |
| Standard Deviation (Population) | 0.67% | 0.84% |
Similar Demographics by No Schooling Completed
Demographics Similar to Hmong by No Schooling Completed
In terms of no schooling completed, the demographic groups most similar to Hmong are Burmese (1.9%, a difference of 0.090%), Menominee (1.9%, a difference of 0.40%), Immigrants from Turkey (1.9%, a difference of 0.65%), Colville (1.9%, a difference of 0.75%), and Filipino (2.0%, a difference of 0.95%).
| Demographics | Rating | Rank | No Schooling Completed |
| Spaniards | 92.3 /100 | #128 | Exceptional 1.9% |
| Seminole | 92.0 /100 | #129 | Exceptional 1.9% |
| Palestinians | 91.8 /100 | #130 | Exceptional 1.9% |
| Immigrants | Hungary | 91.6 /100 | #131 | Exceptional 1.9% |
| Colville | 90.4 /100 | #132 | Exceptional 1.9% |
| Immigrants | Turkey | 90.2 /100 | #133 | Exceptional 1.9% |
| Menominee | 89.6 /100 | #134 | Excellent 1.9% |
| Hmong | 88.5 /100 | #135 | Excellent 1.9% |
| Burmese | 88.2 /100 | #136 | Excellent 1.9% |
| Filipinos | 85.5 /100 | #137 | Excellent 2.0% |
| Immigrants | Israel | 85.4 /100 | #138 | Excellent 2.0% |
| Jordanians | 84.5 /100 | #139 | Excellent 2.0% |
| Marshallese | 83.5 /100 | #140 | Excellent 2.0% |
| Immigrants | Greece | 83.5 /100 | #141 | Excellent 2.0% |
| Venezuelans | 81.5 /100 | #142 | Excellent 2.0% |
Demographics Similar to Immigrants from Zimbabwe by No Schooling Completed
In terms of no schooling completed, the demographic groups most similar to Immigrants from Zimbabwe are Immigrants from Norway (1.9%, a difference of 0.010%), Syrian (1.9%, a difference of 0.14%), Lebanese (1.9%, a difference of 0.16%), Pueblo (1.9%, a difference of 0.25%), and Immigrants from Serbia (1.9%, a difference of 0.36%).
| Demographics | Rating | Rank | No Schooling Completed |
| Immigrants | France | 97.3 /100 | #106 | Exceptional 1.8% |
| Yugoslavians | 97.2 /100 | #107 | Exceptional 1.8% |
| Okinawans | 97.1 /100 | #108 | Exceptional 1.8% |
| Immigrants | Saudi Arabia | 96.8 /100 | #109 | Exceptional 1.9% |
| Immigrants | Latvia | 96.7 /100 | #110 | Exceptional 1.9% |
| Immigrants | Japan | 96.6 /100 | #111 | Exceptional 1.9% |
| Pueblo | 96.4 /100 | #112 | Exceptional 1.9% |
| Immigrants | Zimbabwe | 96.2 /100 | #113 | Exceptional 1.9% |
| Immigrants | Norway | 96.1 /100 | #114 | Exceptional 1.9% |
| Syrians | 96.0 /100 | #115 | Exceptional 1.9% |
| Lebanese | 96.0 /100 | #116 | Exceptional 1.9% |
| Immigrants | Serbia | 95.8 /100 | #117 | Exceptional 1.9% |
| Spanish | 95.5 /100 | #118 | Exceptional 1.9% |
| Iroquois | 95.1 /100 | #119 | Exceptional 1.9% |
| Immigrants | Bulgaria | 94.6 /100 | #120 | Exceptional 1.9% |