Hispanic or Latino vs Swiss 9th Grade
COMPARE
Hispanic or Latino
Swiss
9th Grade
9th Grade Comparison
Hispanics or Latinos
Swiss
90.9%
9TH GRADE
0.0/ 100
METRIC RATING
332nd/ 347
METRIC RANK
95.7%
9TH GRADE
99.2/ 100
METRIC RATING
83rd/ 347
METRIC RANK
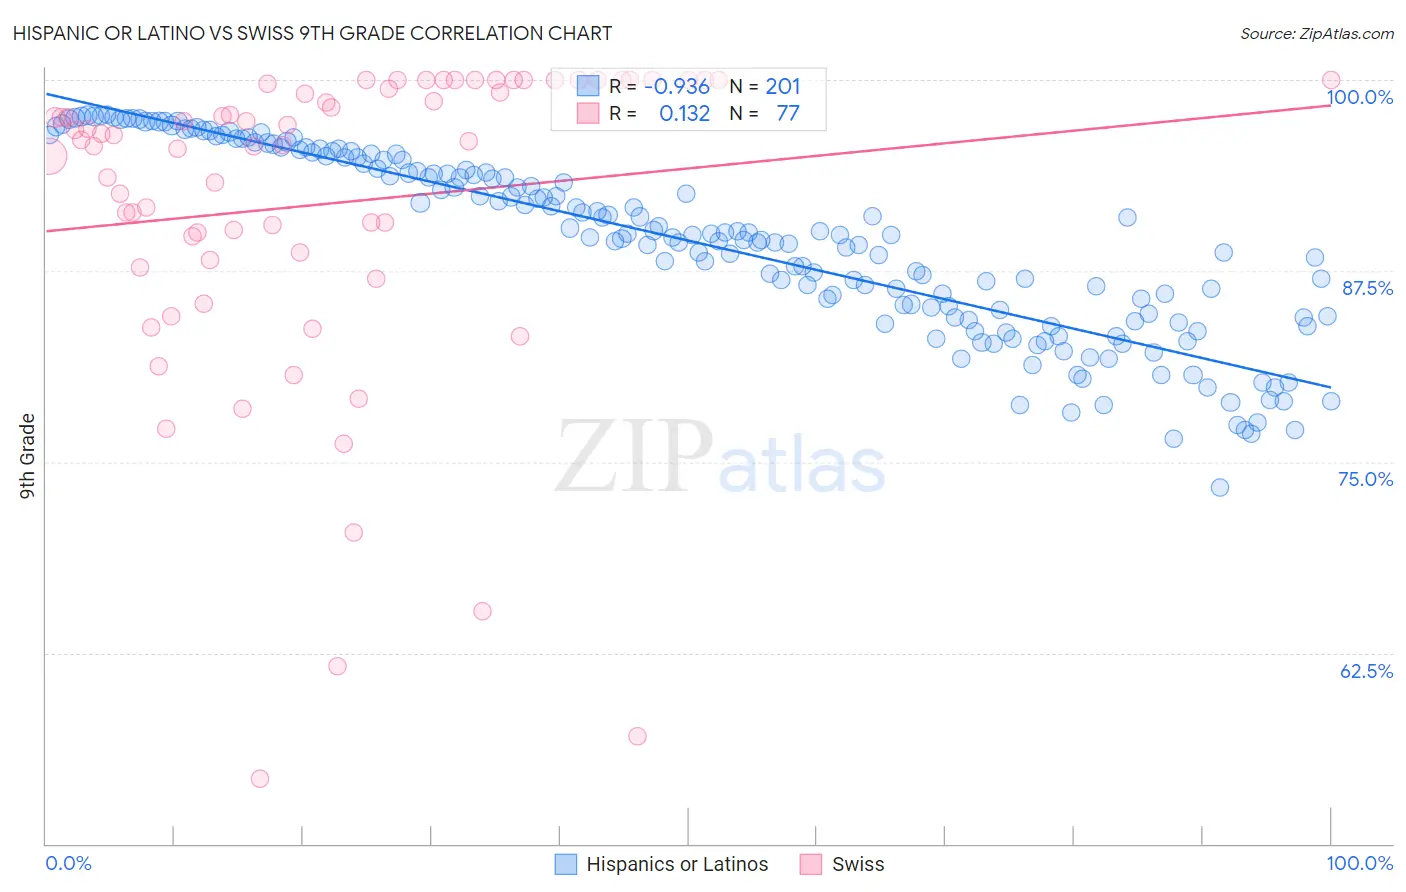
Hispanic or Latino vs Swiss 9th Grade Correlation Chart
The statistical analysis conducted on geographies consisting of 578,614,190 people shows a near-perfect negative correlation between the proportion of Hispanics or Latinos and percentage of population with at least 9th grade education in the United States with a correlation coefficient (R) of -0.936 and weighted average of 90.9%. Similarly, the statistical analysis conducted on geographies consisting of 465,022,424 people shows a poor positive correlation between the proportion of Swiss and percentage of population with at least 9th grade education in the United States with a correlation coefficient (R) of 0.132 and weighted average of 95.7%, a difference of 5.3%.
9th Grade Correlation Summary
| Measurement | Hispanic or Latino | Swiss |
| Minimum | 73.3% | 54.2% |
| Maximum | 97.7% | 100.0% |
| Range | 24.4% | 45.8% |
| Mean | 89.4% | 91.9% |
| Median | 89.9% | 96.1% |
| Interquartile 25% (IQ1) | 84.6% | 88.4% |
| Interquartile 75% (IQ3) | 94.9% | 99.9% |
| Interquartile Range (IQR) | 10.3% | 11.4% |
| Standard Deviation (Sample) | 6.0% | 10.4% |
| Standard Deviation (Population) | 6.0% | 10.3% |
Similar Demographics by 9th Grade
Demographics Similar to Hispanics or Latinos by 9th Grade
In terms of 9th grade, the demographic groups most similar to Hispanics or Latinos are Mexican American Indian (90.9%, a difference of 0.020%), Immigrants from Cabo Verde (90.9%, a difference of 0.050%), Immigrants from Yemen (90.8%, a difference of 0.090%), Immigrants from the Azores (90.8%, a difference of 0.14%), and Honduran (91.0%, a difference of 0.17%).
| Demographics | Rating | Rank | 9th Grade |
| Central American Indians | 0.0 /100 | #325 | Tragic 91.5% |
| Immigrants | Armenia | 0.0 /100 | #326 | Tragic 91.4% |
| Immigrants | Nicaragua | 0.0 /100 | #327 | Tragic 91.3% |
| Dominicans | 0.0 /100 | #328 | Tragic 91.1% |
| Hondurans | 0.0 /100 | #329 | Tragic 91.0% |
| Immigrants | Cabo Verde | 0.0 /100 | #330 | Tragic 90.9% |
| Mexican American Indians | 0.0 /100 | #331 | Tragic 90.9% |
| Hispanics or Latinos | 0.0 /100 | #332 | Tragic 90.9% |
| Immigrants | Yemen | 0.0 /100 | #333 | Tragic 90.8% |
| Immigrants | Azores | 0.0 /100 | #334 | Tragic 90.8% |
| Immigrants | Honduras | 0.0 /100 | #335 | Tragic 90.6% |
| Immigrants | Dominican Republic | 0.0 /100 | #336 | Tragic 90.5% |
| Immigrants | Latin America | 0.0 /100 | #337 | Tragic 90.4% |
| Central Americans | 0.0 /100 | #338 | Tragic 90.4% |
| Yakama | 0.0 /100 | #339 | Tragic 90.1% |
Demographics Similar to Swiss by 9th Grade
In terms of 9th grade, the demographic groups most similar to Swiss are Immigrants from Denmark (95.7%, a difference of 0.010%), Icelander (95.7%, a difference of 0.010%), Immigrants from Western Europe (95.7%, a difference of 0.010%), Bhutanese (95.7%, a difference of 0.020%), and Arapaho (95.7%, a difference of 0.020%).
| Demographics | Rating | Rank | 9th Grade |
| Immigrants | Sweden | 99.5 /100 | #76 | Exceptional 95.8% |
| Whites/Caucasians | 99.4 /100 | #77 | Exceptional 95.8% |
| Immigrants | South Africa | 99.4 /100 | #78 | Exceptional 95.8% |
| Romanians | 99.3 /100 | #79 | Exceptional 95.7% |
| Bhutanese | 99.3 /100 | #80 | Exceptional 95.7% |
| Arapaho | 99.3 /100 | #81 | Exceptional 95.7% |
| Puget Sound Salish | 99.2 /100 | #82 | Exceptional 95.7% |
| Swiss | 99.2 /100 | #83 | Exceptional 95.7% |
| Immigrants | Denmark | 99.1 /100 | #84 | Exceptional 95.7% |
| Icelanders | 99.1 /100 | #85 | Exceptional 95.7% |
| Immigrants | Western Europe | 99.1 /100 | #86 | Exceptional 95.7% |
| Okinawans | 99.0 /100 | #87 | Exceptional 95.7% |
| Immigrants | Czechoslovakia | 98.9 /100 | #88 | Exceptional 95.7% |
| Yugoslavians | 98.9 /100 | #89 | Exceptional 95.7% |
| South Africans | 98.8 /100 | #90 | Exceptional 95.6% |