German vs Immigrants from Bulgaria Master's Degree
COMPARE
German
Immigrants from Bulgaria
Master's Degree
Master's Degree Comparison
Germans
Immigrants from Bulgaria
14.0%
MASTER'S DEGREE
13.1/ 100
METRIC RATING
220th/ 347
METRIC RANK
18.3%
MASTER'S DEGREE
99.9/ 100
METRIC RATING
59th/ 347
METRIC RANK
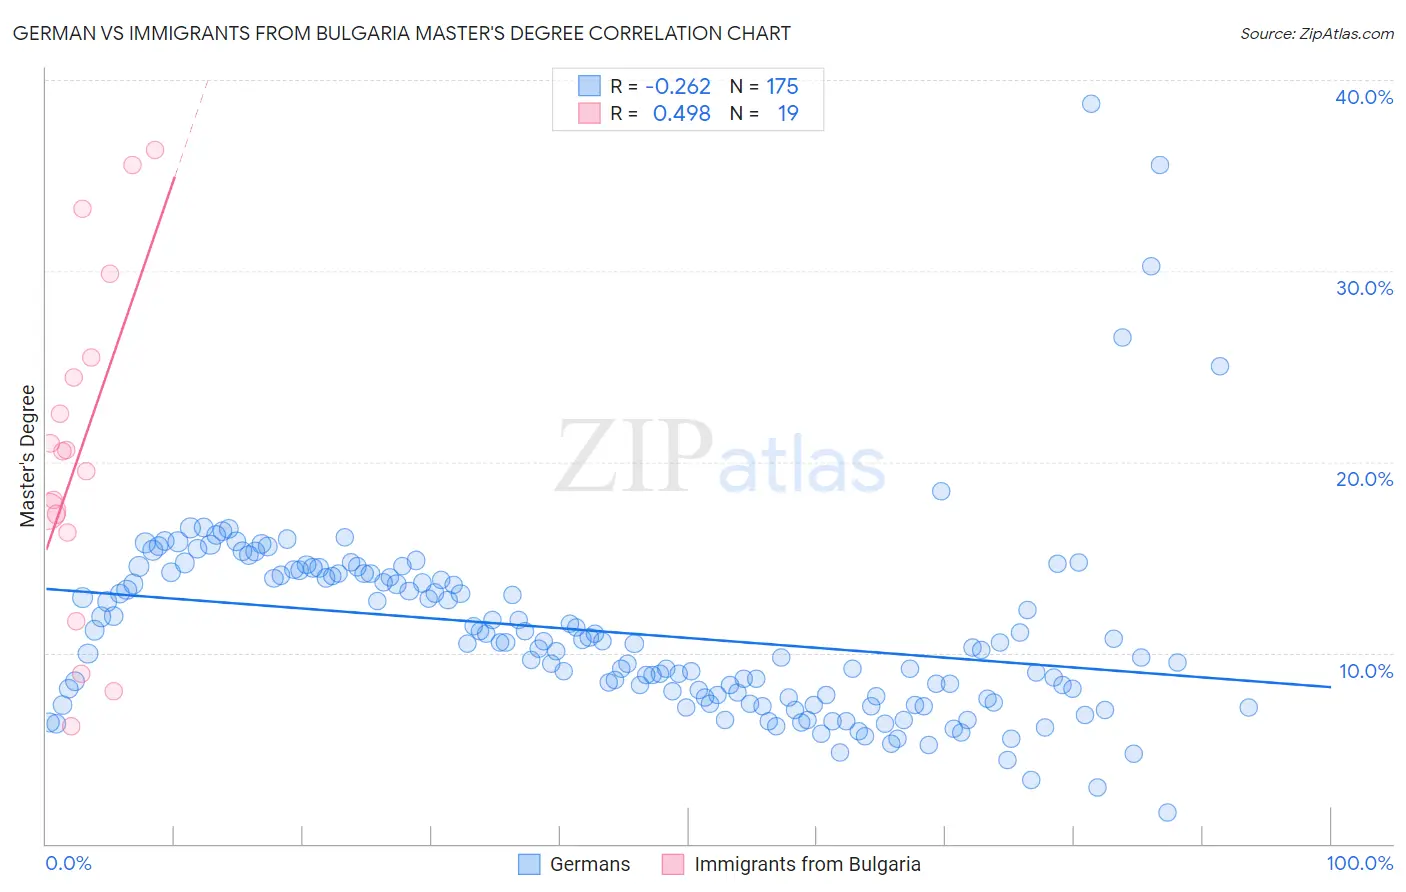
German vs Immigrants from Bulgaria Master's Degree Correlation Chart
The statistical analysis conducted on geographies consisting of 579,621,104 people shows a weak negative correlation between the proportion of Germans and percentage of population with at least master's degree education in the United States with a correlation coefficient (R) of -0.262 and weighted average of 14.0%. Similarly, the statistical analysis conducted on geographies consisting of 172,543,747 people shows a moderate positive correlation between the proportion of Immigrants from Bulgaria and percentage of population with at least master's degree education in the United States with a correlation coefficient (R) of 0.498 and weighted average of 18.3%, a difference of 30.6%.
Master's Degree Correlation Summary
| Measurement | German | Immigrants from Bulgaria |
| Minimum | 1.7% | 6.1% |
| Maximum | 38.7% | 36.3% |
| Range | 37.1% | 30.2% |
| Mean | 11.1% | 20.7% |
| Median | 10.5% | 20.6% |
| Interquartile 25% (IQ1) | 7.6% | 16.3% |
| Interquartile 75% (IQ3) | 14.0% | 25.5% |
| Interquartile Range (IQR) | 6.4% | 9.2% |
| Standard Deviation (Sample) | 5.0% | 8.8% |
| Standard Deviation (Population) | 5.0% | 8.6% |
Similar Demographics by Master's Degree
Demographics Similar to Germans by Master's Degree
In terms of master's degree, the demographic groups most similar to Germans are Korean (14.0%, a difference of 0.13%), Norwegian (14.0%, a difference of 0.15%), Ecuadorian (14.0%, a difference of 0.17%), Immigrants from South Eastern Asia (14.0%, a difference of 0.37%), and Immigrants from Grenada (14.0%, a difference of 0.41%).
| Demographics | Rating | Rank | Master's Degree |
| Immigrants | Thailand | 17.0 /100 | #213 | Poor 14.2% |
| Finns | 16.9 /100 | #214 | Poor 14.2% |
| Immigrants | Vietnam | 16.1 /100 | #215 | Poor 14.1% |
| Immigrants | Somalia | 15.8 /100 | #216 | Poor 14.1% |
| Immigrants | Trinidad and Tobago | 15.8 /100 | #217 | Poor 14.1% |
| French Canadians | 14.9 /100 | #218 | Poor 14.1% |
| Norwegians | 13.6 /100 | #219 | Poor 14.0% |
| Germans | 13.1 /100 | #220 | Poor 14.0% |
| Koreans | 12.7 /100 | #221 | Poor 14.0% |
| Ecuadorians | 12.6 /100 | #222 | Poor 14.0% |
| Immigrants | South Eastern Asia | 11.9 /100 | #223 | Poor 14.0% |
| Immigrants | Grenada | 11.8 /100 | #224 | Poor 14.0% |
| Portuguese | 11.2 /100 | #225 | Poor 13.9% |
| Immigrants | St. Vincent and the Grenadines | 11.0 /100 | #226 | Poor 13.9% |
| Immigrants | West Indies | 9.8 /100 | #227 | Tragic 13.9% |
Demographics Similar to Immigrants from Bulgaria by Master's Degree
In terms of master's degree, the demographic groups most similar to Immigrants from Bulgaria are New Zealander (18.3%, a difference of 0.23%), Immigrants from Europe (18.2%, a difference of 0.38%), Australian (18.4%, a difference of 0.44%), Immigrants from Asia (18.4%, a difference of 0.57%), and Asian (18.4%, a difference of 0.71%).
| Demographics | Rating | Rank | Master's Degree |
| Immigrants | Kuwait | 100.0 /100 | #52 | Exceptional 18.6% |
| Immigrants | Czechoslovakia | 99.9 /100 | #53 | Exceptional 18.5% |
| Immigrants | Lithuania | 99.9 /100 | #54 | Exceptional 18.5% |
| Immigrants | Serbia | 99.9 /100 | #55 | Exceptional 18.5% |
| Asians | 99.9 /100 | #56 | Exceptional 18.4% |
| Immigrants | Asia | 99.9 /100 | #57 | Exceptional 18.4% |
| Australians | 99.9 /100 | #58 | Exceptional 18.4% |
| Immigrants | Bulgaria | 99.9 /100 | #59 | Exceptional 18.3% |
| New Zealanders | 99.9 /100 | #60 | Exceptional 18.3% |
| Immigrants | Europe | 99.9 /100 | #61 | Exceptional 18.2% |
| Argentineans | 99.9 /100 | #62 | Exceptional 18.2% |
| Immigrants | Netherlands | 99.9 /100 | #63 | Exceptional 18.1% |
| South Africans | 99.9 /100 | #64 | Exceptional 18.1% |
| Immigrants | Kazakhstan | 99.8 /100 | #65 | Exceptional 18.0% |
| Ethiopians | 99.8 /100 | #66 | Exceptional 18.0% |