Alaska Native vs Immigrants from Bulgaria Master's Degree

COMPARE

Alaska Native
Race
Ancestry
AfghanAfricanAlaska NativeAlaskan AthabascanAlbanianAleutAlsatianAmericanApacheArabArapahoArgentineanArmenianAssyrian/Chaldean/SyriacAustralianAustrianBahamianBangladeshiBarbadianBasqueBelgianBelizeanBermudanBhutaneseBlackfeetBolivianBrazilianBritishBritish West IndianBulgarianBurmeseCajunCambodianCanadianCape VerdeanCarpatho RusynCelticCentral AmericanCentral American IndianCherokeeCheyenneChickasawChileanChineseChippewaChoctawColombianColvilleComancheCosta RicanCreeCreekCroatianCrowCubanCypriotCzechCzechoslovakianDanishDelawareDominicanDutchDutch West IndianEastern EuropeanEcuadorianEgyptianEnglishEstonianEthiopianEuropeanFijianFilipinoFinnishFrenchFrench American IndianFrench CanadianGermanGerman RussianGhanaianGreekGuamanian/ChamorroGuatemalanGuyaneseHaitianHmongHonduranHopiHoumaHungarianIcelanderIndian (Asian)IndonesianInupiatIranianIraqiIrishIroquoisIsraeliItalianJamaicanJapaneseJordanianKenyanKiowaKoreanLaotianLatvianLebaneseLiberianLithuanianLumbeeLuxembourgerMacedonianMalaysianMalteseMarshalleseMenomineeMexicanMexican American IndianMongolianMoroccanNative HawaiianNavajoNepaleseNew ZealanderNicaraguanNigerianNorthern EuropeanNorwegianOkinawanOsageOttawaPaiutePakistaniPalestinianPanamanianParaguayanPennsylvania GermanPeruvianPimaPolishPortuguesePotawatomiPuebloPuerto RicanPuget Sound SalishRomanianRussianSalvadoranSamoanScandinavianScotch-IrishScottishSeminoleSenegaleseSerbianShoshoneSierra LeoneanSiouxSlavicSlovakSloveneSomaliSouth AfricanSouth AmericanSouth American IndianSoviet UnionSpaniardSpanishSpanish AmericanSpanish American IndianSri LankanSubsaharan AfricanSudaneseSwedishSwissSyrianTaiwaneseThaiTlingit-HaidaTohono O'OdhamTonganTrinidadian and TobagonianTsimshianTurkishU.S. Virgin IslanderUgandanUkrainianUruguayanUteVenezuelanVietnameseWelshWest IndianYakamaYaquiYugoslavianYumanYup'ikZimbabwean
Immigration
NonimmigrantsImmigrantsAfghanistanAfricaAlbaniaArgentinaArmeniaAsiaAustraliaAustriaBahamasBangladeshBarbadosBelarusBelgiumBelizeBoliviaBosnia and HerzegovinaBrazilBurma/MyanmarCabo VerdeCambodiaCameroonCanadaCaribbeanCentral AmericaChileChinaColombiaCongoCosta RicaCroatiaCubaCzechoslovakiaDenmarkDominicaDominican RepublicEastern AfricaEastern AsiaEastern EuropeEcuadorEgyptEl SalvadorEnglandEritreaEthiopiaEuropeFijiFranceGermanyGhanaGreeceGrenadaGuatemalaGuyanaHaitiHondurasHong KongHungaryIndiaIndonesiaIranIraqIrelandIsraelItalyJamaicaJapanJordanKazakhstanKenyaKoreaKuwaitLaosLatin AmericaLatviaLebanonLiberiaLithuaniaMalaysiaMexicoMicronesiaMiddle AfricaMoldovaMoroccoNepalNetherlandsNicaraguaNigeriaNorth AmericaNorth MacedoniaNorthern AfricaNorthern EuropeNorwayOceaniaPakistanPanamaPeruPhilippinesPolandPortugalRomaniaRussiaSaudi ArabiaScotlandSenegalSerbiaSierra LeoneSingaporeSomaliaSouth AfricaSouth AmericaSouth Central AsiaSouth Eastern AsiaSouthern EuropeSpainSri LankaSt. Vincent and the GrenadinesSudanSwedenSwitzerlandSyriaTaiwanThailandTrinidad and TobagoTurkeyUgandaUkraineUruguayUzbekistanVenezuelaVietnamWest IndiesWestern AfricaWestern AsiaWestern EuropeYemenZaireZimbabweAzores
Immigrants from Bulgaria
Race
Ancestry
AfghanAfricanAlaskan AthabascanAlbanianAleutAlsatianAmericanApacheArabArapahoArgentineanArmenianAssyrian/Chaldean/SyriacAustralianAustrianBahamianBangladeshiBarbadianBasqueBelgianBelizeanBermudanBhutaneseBlackfeetBolivianBrazilianBritishBritish West IndianBulgarianBurmeseCajunCambodianCanadianCape VerdeanCarpatho RusynCelticCentral AmericanCentral American IndianCherokeeCheyenneChickasawChileanChineseChippewaChoctawColombianColvilleComancheCosta RicanCreeCreekCroatianCrowCubanCypriotCzechCzechoslovakianDanishDelawareDominicanDutchDutch West IndianEastern EuropeanEcuadorianEgyptianEnglishEstonianEthiopianEuropeanFijianFilipinoFinnishFrenchFrench American IndianFrench CanadianGermanGerman RussianGhanaianGreekGuamanian/ChamorroGuatemalanGuyaneseHaitianHmongHonduranHopiHoumaHungarianIcelanderIndian (Asian)IndonesianInupiatIranianIraqiIrishIroquoisIsraeliItalianJamaicanJapaneseJordanianKenyanKiowaKoreanLaotianLatvianLebaneseLiberianLithuanianLumbeeLuxembourgerMacedonianMalaysianMalteseMarshalleseMenomineeMexicanMexican American IndianMongolianMoroccanNative HawaiianNavajoNepaleseNew ZealanderNicaraguanNigerianNorthern EuropeanNorwegianOkinawanOsageOttawaPaiutePakistaniPalestinianPanamanianParaguayanPennsylvania GermanPeruvianPimaPolishPortuguesePotawatomiPuebloPuerto RicanPuget Sound SalishRomanianRussianSalvadoranSamoanScandinavianScotch-IrishScottishSeminoleSenegaleseSerbianShoshoneSierra LeoneanSiouxSlavicSlovakSloveneSomaliSouth AfricanSouth AmericanSouth American IndianSoviet UnionSpaniardSpanishSpanish AmericanSpanish American IndianSri LankanSubsaharan AfricanSudaneseSwedishSwissSyrianTaiwaneseThaiTlingit-HaidaTohono O'OdhamTonganTrinidadian and TobagonianTsimshianTurkishU.S. Virgin IslanderUgandanUkrainianUruguayanUteVenezuelanVietnameseWelshWest IndianYakamaYaquiYugoslavianYumanYup'ikZimbabwean
Immigration
NonimmigrantsImmigrantsAfghanistanAfricaAlbaniaArgentinaArmeniaAsiaAustraliaAustriaBahamasBangladeshBarbadosBelarusBelgiumBelizeBoliviaBosnia and HerzegovinaBrazilBulgariaBurma/MyanmarCabo VerdeCambodiaCameroonCanadaCaribbeanCentral AmericaChileChinaColombiaCongoCosta RicaCroatiaCubaCzechoslovakiaDenmarkDominicaDominican RepublicEastern AfricaEastern AsiaEastern EuropeEcuadorEgyptEl SalvadorEnglandEritreaEthiopiaEuropeFijiFranceGermanyGhanaGreeceGrenadaGuatemalaGuyanaHaitiHondurasHong KongHungaryIndiaIndonesiaIranIraqIrelandIsraelItalyJamaicaJapanJordanKazakhstanKenyaKoreaKuwaitLaosLatin AmericaLatviaLebanonLiberiaLithuaniaMalaysiaMexicoMicronesiaMiddle AfricaMoldovaMoroccoNepalNetherlandsNicaraguaNigeriaNorth AmericaNorth MacedoniaNorthern AfricaNorthern EuropeNorwayOceaniaPakistanPanamaPeruPhilippinesPolandPortugalRomaniaRussiaSaudi ArabiaScotlandSenegalSerbiaSierra LeoneSingaporeSomaliaSouth AfricaSouth AmericaSouth Central AsiaSouth Eastern AsiaSouthern EuropeSpainSri LankaSt. Vincent and the GrenadinesSudanSwedenSwitzerlandSyriaTaiwanThailandTrinidad and TobagoTurkeyUgandaUkraineUruguayUzbekistanVenezuelaVietnamWest IndiesWestern AfricaWestern AsiaWestern EuropeYemenZaireZimbabweAzores
Master's Degree
Income
Poverty
Unemployment
Labor Participation
Family Structure
Vehicle Availability
Education Level
Disability

Master's Degree Comparison

Alaska Natives

Immigrants from Bulgaria

Tragic
Exceptional
11.6%
MASTER'S DEGREE
0.1/ 100
METRIC RATING
293rd/ 347
METRIC RANK
18.3%
MASTER'S DEGREE
99.9/ 100
METRIC RATING
59th/ 347
METRIC RANK

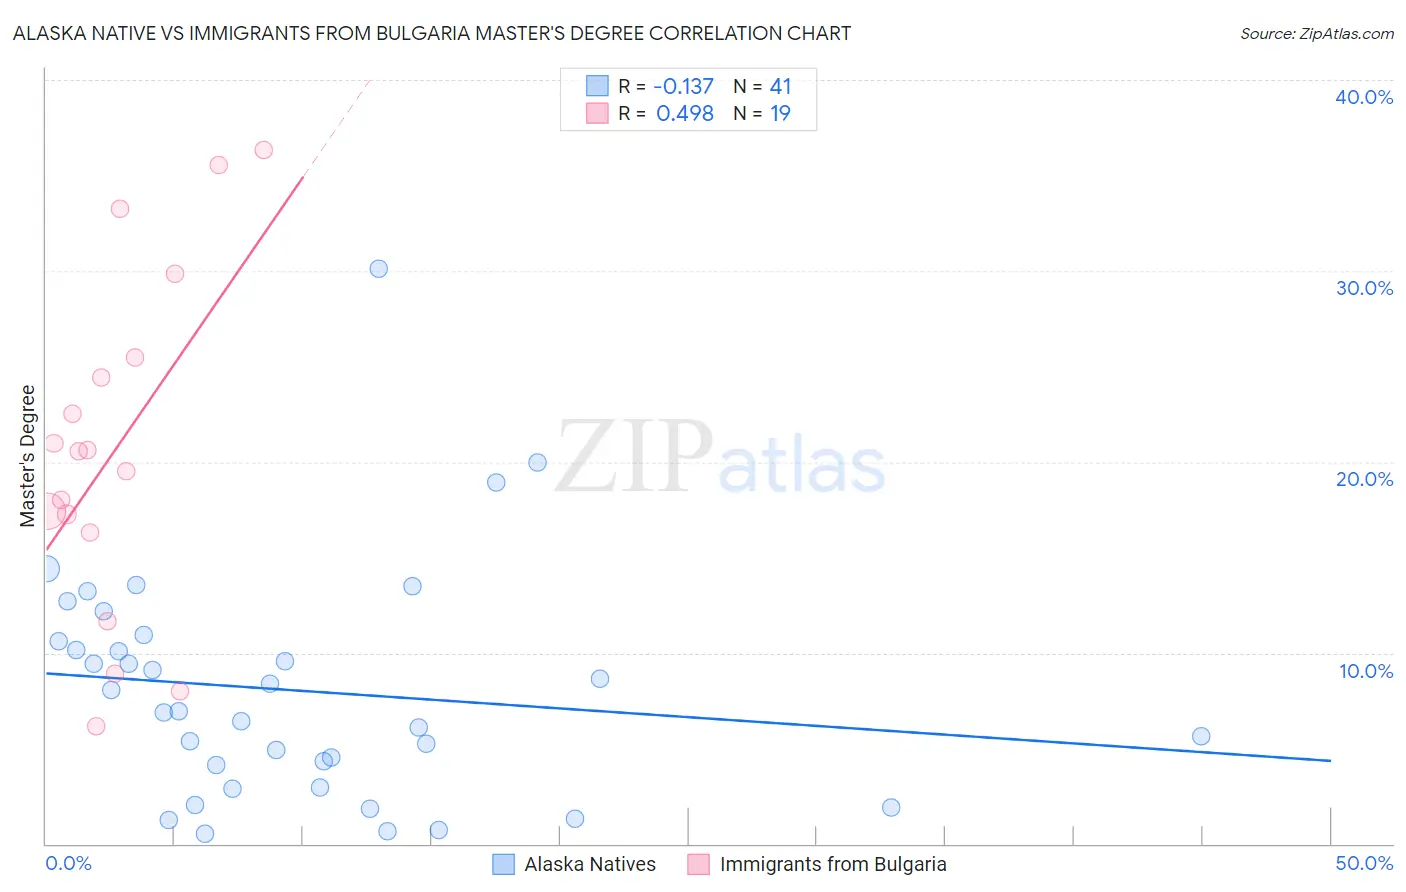
Alaska Native vs Immigrants from Bulgaria Master's Degree Correlation Chart

The statistical analysis conducted on geographies consisting of 76,746,522 people shows a poor negative correlation between the proportion of Alaska Natives and percentage of population with at least master's degree education in the United States with a correlation coefficient (R) of -0.137 and weighted average of 11.6%. Similarly, the statistical analysis conducted on geographies consisting of 172,543,747 people shows a moderate positive correlation between the proportion of Immigrants from Bulgaria and percentage of population with at least master's degree education in the United States with a correlation coefficient (R) of 0.498 and weighted average of 18.3%, a difference of 57.9%.
Alaska Native vs Immigrants from Bulgaria Master's Degree

Master's Degree Correlation Summary

MeasurementAlaska NativeImmigrants from Bulgaria
Minimum0.50%6.1%
Maximum30.1%36.3%
Range29.6%30.2%
Mean8.0%20.7%
Median7.0%20.6%
Interquartile 25% (IQ1)3.5%16.3%
Interquartile 75% (IQ3)10.8%25.5%
Interquartile Range (IQR)7.2%9.2%
Standard Deviation (Sample)6.0%8.8%
Standard Deviation (Population)5.9%8.6%

Similar Demographics by Master's Degree

Demographics Similar to Alaska Natives by Master's Degree

In terms of master's degree, the demographic groups most similar to Alaska Natives are Hawaiian (11.6%, a difference of 0.10%), Immigrants from Guatemala (11.6%, a difference of 0.23%), Marshallese (11.6%, a difference of 0.25%), Alaskan Athabascan (11.6%, a difference of 0.26%), and Colville (11.6%, a difference of 0.35%).
DemographicsRating | RankMaster's Degree
Aleuts
0.1
/100
|
#286
Tragic
11.8%
Immigrants | Haiti
0.1
/100
|
#287
Tragic
11.8%
Immigrants | Honduras
0.1
/100
|
#288
Tragic
11.8%
Guatemalans
0.1
/100
|
#289
Tragic
11.7%
Ute
0.1
/100
|
#290
Tragic
11.7%
Colville
0.1
/100
|
#291
Tragic
11.6%
Immigrants | Guatemala
0.1
/100
|
#292
Tragic
11.6%
Alaska Natives
0.1
/100
|
#293
Tragic
11.6%
Hawaiians
0.1
/100
|
#294
Tragic
11.6%
Marshallese
0.1
/100
|
#295
Tragic
11.6%
Alaskan Athabascans
0.1
/100
|
#296
Tragic
11.6%
Immigrants | Yemen
0.1
/100
|
#297
Tragic
11.6%
Samoans
0.1
/100
|
#298
Tragic
11.5%
Chickasaw
0.1
/100
|
#299
Tragic
11.4%
Chippewa
0.1
/100
|
#300
Tragic
11.4%

Demographics Similar to Immigrants from Bulgaria by Master's Degree

In terms of master's degree, the demographic groups most similar to Immigrants from Bulgaria are New Zealander (18.3%, a difference of 0.23%), Immigrants from Europe (18.2%, a difference of 0.38%), Australian (18.4%, a difference of 0.44%), Immigrants from Asia (18.4%, a difference of 0.57%), and Asian (18.4%, a difference of 0.71%).
DemographicsRating | RankMaster's Degree
Immigrants | Kuwait
100.0
/100
|
#52
Exceptional
18.6%
Immigrants | Czechoslovakia
99.9
/100
|
#53
Exceptional
18.5%
Immigrants | Lithuania
99.9
/100
|
#54
Exceptional
18.5%
Immigrants | Serbia
99.9
/100
|
#55
Exceptional
18.5%
Asians
99.9
/100
|
#56
Exceptional
18.4%
Immigrants | Asia
99.9
/100
|
#57
Exceptional
18.4%
Australians
99.9
/100
|
#58
Exceptional
18.4%
Immigrants | Bulgaria
99.9
/100
|
#59
Exceptional
18.3%
New Zealanders
99.9
/100
|
#60
Exceptional
18.3%
Immigrants | Europe
99.9
/100
|
#61
Exceptional
18.2%
Argentineans
99.9
/100
|
#62
Exceptional
18.2%
Immigrants | Netherlands
99.9
/100
|
#63
Exceptional
18.1%
South Africans
99.9
/100
|
#64
Exceptional
18.1%
Immigrants | Kazakhstan
99.8
/100
|
#65
Exceptional
18.0%
Ethiopians
99.8
/100
|
#66
Exceptional
18.0%