Finnish vs Hungarian College, Under 1 year

COMPARE

Finnish
Race
Ancestry
AfghanAfricanAlaska NativeAlaskan AthabascanAlbanianAleutAlsatianAmericanApacheArabArapahoArgentineanArmenianAssyrian/Chaldean/SyriacAustralianAustrianBahamianBangladeshiBarbadianBasqueBelgianBelizeanBermudanBhutaneseBlackfeetBolivianBrazilianBritishBritish West IndianBulgarianBurmeseCajunCambodianCanadianCape VerdeanCarpatho RusynCelticCentral AmericanCentral American IndianCherokeeCheyenneChickasawChileanChineseChippewaChoctawColombianColvilleComancheCosta RicanCreeCreekCroatianCrowCubanCypriotCzechCzechoslovakianDanishDelawareDominicanDutchDutch West IndianEastern EuropeanEcuadorianEgyptianEnglishEstonianEthiopianEuropeanFijianFilipinoFinnishFrenchFrench American IndianFrench CanadianGermanGerman RussianGhanaianGreekGuamanian/ChamorroGuatemalanGuyaneseHaitianHmongHonduranHopiHoumaIcelanderIndian (Asian)IndonesianInupiatIranianIraqiIrishIroquoisIsraeliItalianJamaicanJapaneseJordanianKenyanKiowaKoreanLaotianLatvianLebaneseLiberianLithuanianLumbeeLuxembourgerMacedonianMalaysianMalteseMarshalleseMenomineeMexicanMexican American IndianMongolianMoroccanNative HawaiianNavajoNepaleseNew ZealanderNicaraguanNigerianNorthern EuropeanNorwegianOkinawanOsageOttawaPaiutePakistaniPalestinianPanamanianParaguayanPennsylvania GermanPeruvianPimaPolishPortuguesePotawatomiPuebloPuerto RicanPuget Sound SalishRomanianRussianSalvadoranSamoanScandinavianScotch-IrishScottishSeminoleSenegaleseSerbianShoshoneSierra LeoneanSiouxSlavicSlovakSloveneSomaliSouth AfricanSouth AmericanSouth American IndianSoviet UnionSpaniardSpanishSpanish AmericanSpanish American IndianSri LankanSubsaharan AfricanSudaneseSwedishSwissSyrianTaiwaneseThaiTlingit-HaidaTohono O'OdhamTonganTrinidadian and TobagonianTsimshianTurkishU.S. Virgin IslanderUgandanUkrainianUruguayanUteVenezuelanVietnameseWelshWest IndianYakamaYaquiYugoslavianYumanYup'ikZimbabwean
Immigration
NonimmigrantsImmigrantsAfghanistanAfricaAlbaniaArgentinaArmeniaAsiaAustraliaAustriaBahamasBangladeshBarbadosBelarusBelgiumBelizeBoliviaBosnia and HerzegovinaBrazilBulgariaBurma/MyanmarCabo VerdeCambodiaCameroonCanadaCaribbeanCentral AmericaChileChinaColombiaCongoCosta RicaCroatiaCubaCzechoslovakiaDenmarkDominicaDominican RepublicEastern AfricaEastern AsiaEastern EuropeEcuadorEgyptEl SalvadorEnglandEritreaEthiopiaEuropeFijiFranceGermanyGhanaGreeceGrenadaGuatemalaGuyanaHaitiHondurasHong KongHungaryIndiaIndonesiaIranIraqIrelandIsraelItalyJamaicaJapanJordanKazakhstanKenyaKoreaKuwaitLaosLatin AmericaLatviaLebanonLiberiaLithuaniaMalaysiaMexicoMicronesiaMiddle AfricaMoldovaMoroccoNepalNetherlandsNicaraguaNigeriaNorth AmericaNorth MacedoniaNorthern AfricaNorthern EuropeNorwayOceaniaPakistanPanamaPeruPhilippinesPolandPortugalRomaniaRussiaSaudi ArabiaScotlandSenegalSerbiaSierra LeoneSingaporeSomaliaSouth AfricaSouth AmericaSouth Central AsiaSouth Eastern AsiaSouthern EuropeSpainSri LankaSt. Vincent and the GrenadinesSudanSwedenSwitzerlandSyriaTaiwanThailandTrinidad and TobagoTurkeyUgandaUkraineUruguayUzbekistanVenezuelaVietnamWest IndiesWestern AfricaWestern AsiaWestern EuropeYemenZaireZimbabweAzores
Hungarian
Race
Ancestry
AfghanAfricanAlaska NativeAlaskan AthabascanAlbanianAleutAlsatianAmericanApacheArabArapahoArgentineanArmenianAssyrian/Chaldean/SyriacAustralianAustrianBahamianBangladeshiBarbadianBasqueBelgianBelizeanBermudanBhutaneseBlackfeetBolivianBrazilianBritishBritish West IndianBulgarianBurmeseCajunCambodianCanadianCape VerdeanCarpatho RusynCelticCentral AmericanCentral American IndianCherokeeCheyenneChickasawChileanChineseChippewaChoctawColombianColvilleComancheCosta RicanCreeCreekCroatianCrowCubanCypriotCzechCzechoslovakianDanishDelawareDominicanDutchDutch West IndianEastern EuropeanEcuadorianEgyptianEnglishEstonianEthiopianEuropeanFijianFilipinoFrenchFrench American IndianFrench CanadianGermanGerman RussianGhanaianGreekGuamanian/ChamorroGuatemalanGuyaneseHaitianHmongHonduranHopiHoumaHungarianIcelanderIndian (Asian)IndonesianInupiatIranianIraqiIrishIroquoisIsraeliItalianJamaicanJapaneseJordanianKenyanKiowaKoreanLaotianLatvianLebaneseLiberianLithuanianLumbeeLuxembourgerMacedonianMalaysianMalteseMarshalleseMenomineeMexicanMexican American IndianMongolianMoroccanNative HawaiianNavajoNepaleseNew ZealanderNicaraguanNigerianNorthern EuropeanNorwegianOkinawanOsageOttawaPaiutePakistaniPalestinianPanamanianParaguayanPennsylvania GermanPeruvianPimaPolishPortuguesePotawatomiPuebloPuerto RicanPuget Sound SalishRomanianRussianSalvadoranSamoanScandinavianScotch-IrishScottishSeminoleSenegaleseSerbianShoshoneSierra LeoneanSiouxSlavicSlovakSloveneSomaliSouth AfricanSouth AmericanSouth American IndianSoviet UnionSpaniardSpanishSpanish AmericanSpanish American IndianSri LankanSubsaharan AfricanSudaneseSwedishSwissSyrianTaiwaneseThaiTlingit-HaidaTohono O'OdhamTonganTrinidadian and TobagonianTsimshianTurkishU.S. Virgin IslanderUgandanUkrainianUruguayanUteVenezuelanVietnameseWelshWest IndianYakamaYaquiYugoslavianYumanYup'ikZimbabwean
Immigration
NonimmigrantsImmigrantsAfghanistanAfricaAlbaniaArgentinaArmeniaAsiaAustraliaAustriaBahamasBangladeshBarbadosBelarusBelgiumBelizeBoliviaBosnia and HerzegovinaBrazilBulgariaBurma/MyanmarCabo VerdeCambodiaCameroonCanadaCaribbeanCentral AmericaChileChinaColombiaCongoCosta RicaCroatiaCubaCzechoslovakiaDenmarkDominicaDominican RepublicEastern AfricaEastern AsiaEastern EuropeEcuadorEgyptEl SalvadorEnglandEritreaEthiopiaEuropeFijiFranceGermanyGhanaGreeceGrenadaGuatemalaGuyanaHaitiHondurasHong KongHungaryIndiaIndonesiaIranIraqIrelandIsraelItalyJamaicaJapanJordanKazakhstanKenyaKoreaKuwaitLaosLatin AmericaLatviaLebanonLiberiaLithuaniaMalaysiaMexicoMicronesiaMiddle AfricaMoldovaMoroccoNepalNetherlandsNicaraguaNigeriaNorth AmericaNorth MacedoniaNorthern AfricaNorthern EuropeNorwayOceaniaPakistanPanamaPeruPhilippinesPolandPortugalRomaniaRussiaSaudi ArabiaScotlandSenegalSerbiaSierra LeoneSingaporeSomaliaSouth AfricaSouth AmericaSouth Central AsiaSouth Eastern AsiaSouthern EuropeSpainSri LankaSt. Vincent and the GrenadinesSudanSwedenSwitzerlandSyriaTaiwanThailandTrinidad and TobagoTurkeyUgandaUkraineUruguayUzbekistanVenezuelaVietnamWest IndiesWestern AfricaWestern AsiaWestern EuropeYemenZaireZimbabweAzores
College, Under 1 year
Income
Poverty
Unemployment
Labor Participation
Family Structure
Vehicle Availability
Education Level
Disability

College, Under 1 year Comparison

Finns

Hungarians

Excellent
Average
66.9%
COLLEGE, UNDER 1 YEAR
88.6/ 100
METRIC RATING
131st/ 347
METRIC RANK
65.6%
COLLEGE, UNDER 1 YEAR
55.9/ 100
METRIC RATING
168th/ 347
METRIC RANK

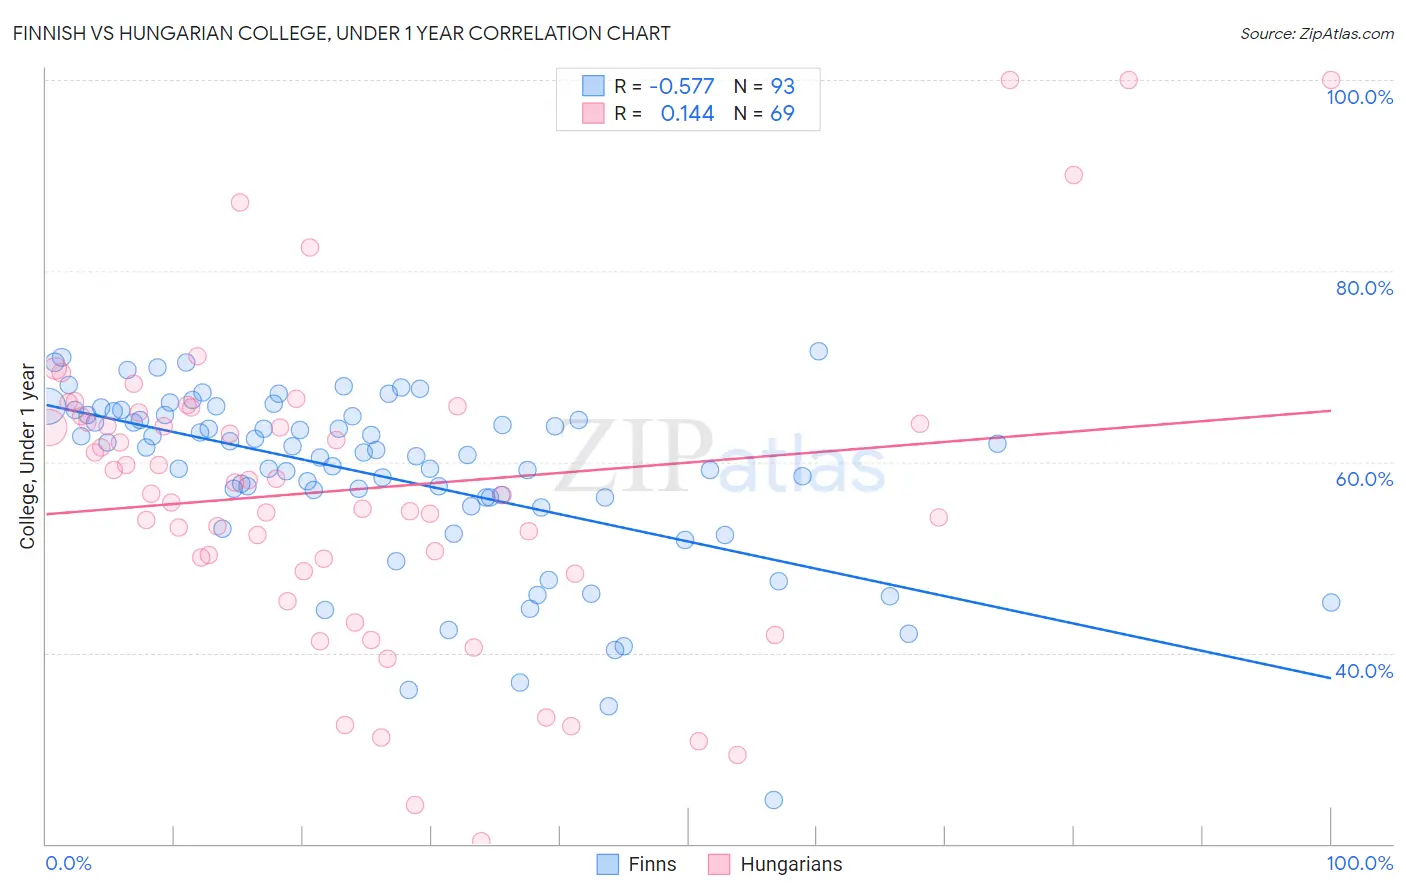
Finnish vs Hungarian College, Under 1 year Correlation Chart

The statistical analysis conducted on geographies consisting of 404,673,530 people shows a substantial negative correlation between the proportion of Finns and percentage of population with at least college, under 1 year education in the United States with a correlation coefficient (R) of -0.577 and weighted average of 66.9%. Similarly, the statistical analysis conducted on geographies consisting of 486,238,564 people shows a poor positive correlation between the proportion of Hungarians and percentage of population with at least college, under 1 year education in the United States with a correlation coefficient (R) of 0.144 and weighted average of 65.6%, a difference of 2.0%.
Finnish vs Hungarian College, Under 1 year

College, Under 1 year Correlation Summary

MeasurementFinnishHungarian
Minimum24.5%20.2%
Maximum71.6%100.0%
Range47.0%79.8%
Mean58.5%57.1%
Median60.9%57.8%
Interquartile 25% (IQ1)55.8%49.2%
Interquartile 75% (IQ3)64.9%65.0%
Interquartile Range (IQR)9.1%15.8%
Standard Deviation (Sample)9.3%16.4%
Standard Deviation (Population)9.2%16.3%

Similar Demographics by College, Under 1 year

Demographics Similar to Finns by College, Under 1 year

In terms of college, under 1 year, the demographic groups most similar to Finns are Polish (66.9%, a difference of 0.020%), Immigrants from Brazil (66.9%, a difference of 0.030%), Immigrants from Syria (66.9%, a difference of 0.040%), Iraqi (66.8%, a difference of 0.060%), and Canadian (66.8%, a difference of 0.070%).
DemographicsRating | RankCollege, Under 1 year
Arabs
92.6
/100
|
#124
Exceptional
67.2%
Italians
91.8
/100
|
#125
Exceptional
67.2%
Alsatians
91.3
/100
|
#126
Exceptional
67.1%
Czechs
90.8
/100
|
#127
Exceptional
67.1%
Scottish
90.2
/100
|
#128
Exceptional
67.0%
Immigrants | Eastern Africa
89.5
/100
|
#129
Excellent
67.0%
Immigrants | Syria
89.0
/100
|
#130
Excellent
66.9%
Finns
88.6
/100
|
#131
Excellent
66.9%
Poles
88.4
/100
|
#132
Excellent
66.9%
Immigrants | Brazil
88.3
/100
|
#133
Excellent
66.9%
Iraqis
88.0
/100
|
#134
Excellent
66.8%
Canadians
87.9
/100
|
#135
Excellent
66.8%
Ugandans
87.8
/100
|
#136
Excellent
66.8%
Immigrants | Chile
87.4
/100
|
#137
Excellent
66.8%
Immigrants | Italy
86.9
/100
|
#138
Excellent
66.8%

Demographics Similar to Hungarians by College, Under 1 year

In terms of college, under 1 year, the demographic groups most similar to Hungarians are Yugoslavian (65.6%, a difference of 0.010%), German (65.6%, a difference of 0.010%), Immigrants from Somalia (65.6%, a difference of 0.020%), Moroccan (65.6%, a difference of 0.030%), and Immigrants from Oceania (65.6%, a difference of 0.040%).
DemographicsRating | RankCollege, Under 1 year
Brazilians
66.0
/100
|
#161
Good
65.9%
Koreans
65.3
/100
|
#162
Good
65.9%
Somalis
62.7
/100
|
#163
Good
65.8%
Czechoslovakians
62.6
/100
|
#164
Good
65.8%
Immigrants | Uzbekistan
61.6
/100
|
#165
Good
65.8%
Moroccans
56.7
/100
|
#166
Average
65.6%
Immigrants | Somalia
56.4
/100
|
#167
Average
65.6%
Hungarians
55.9
/100
|
#168
Average
65.6%
Yugoslavians
55.7
/100
|
#169
Average
65.6%
Germans
55.7
/100
|
#170
Average
65.6%
Immigrants | Oceania
55.0
/100
|
#171
Average
65.6%
South American Indians
54.4
/100
|
#172
Average
65.5%
Swiss
53.9
/100
|
#173
Average
65.5%
Immigrants | Bosnia and Herzegovina
50.0
/100
|
#174
Average
65.4%
Scotch-Irish
49.5
/100
|
#175
Average
65.4%