English vs Tsimshian Associate's Degree
COMPARE
English
Tsimshian
Associate's Degree
Associate's Degree Comparison
English
Tsimshian
46.4%
ASSOCIATE'S DEGREE
50.0/ 100
METRIC RATING
174th/ 347
METRIC RANK
38.6%
ASSOCIATE'S DEGREE
0.0/ 100
METRIC RATING
301st/ 347
METRIC RANK
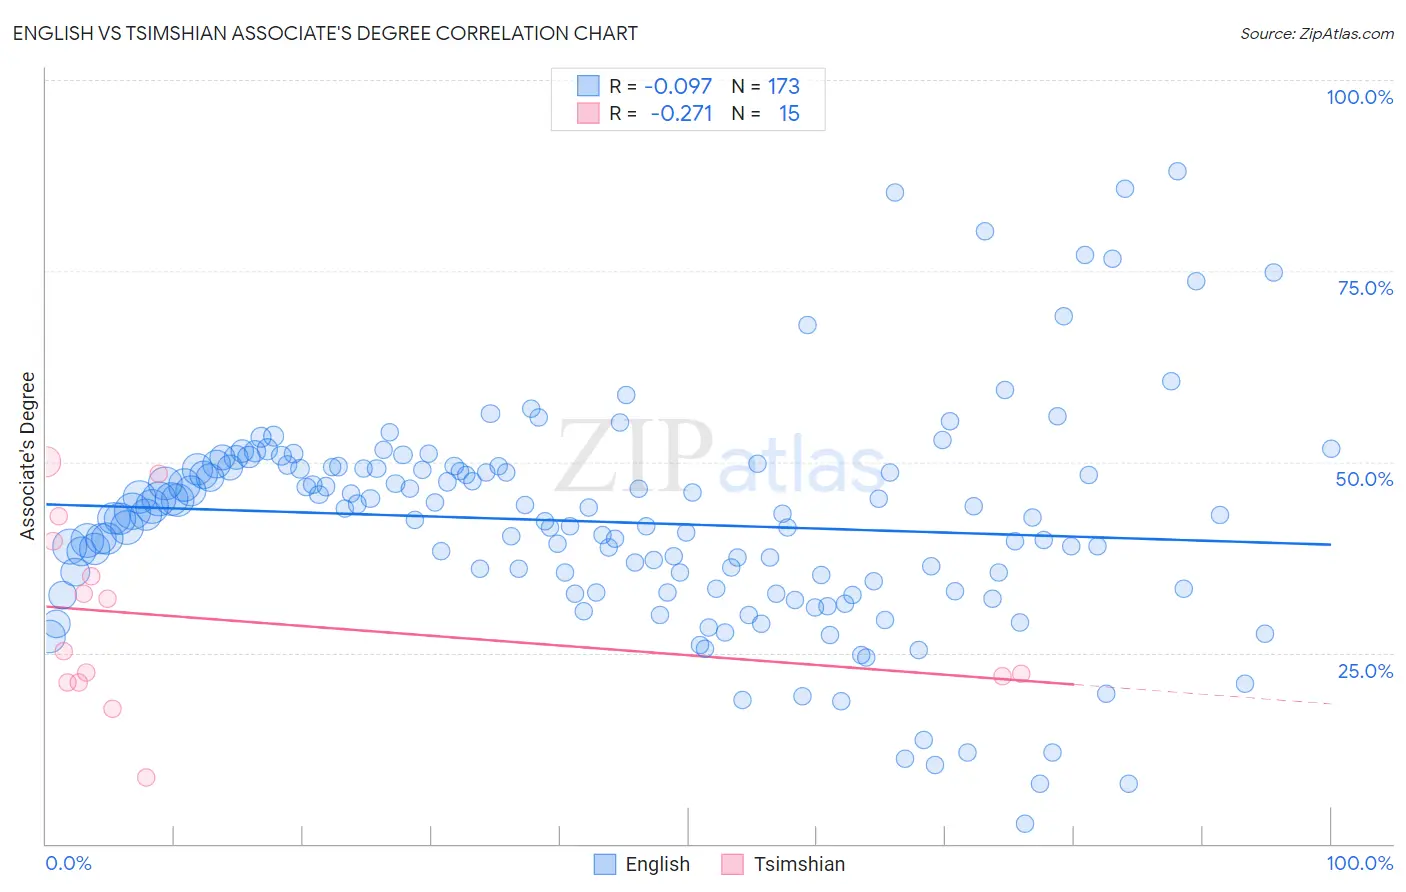
English vs Tsimshian Associate's Degree Correlation Chart
The statistical analysis conducted on geographies consisting of 579,836,667 people shows a slight negative correlation between the proportion of English and percentage of population with at least associate's degree education in the United States with a correlation coefficient (R) of -0.097 and weighted average of 46.4%. Similarly, the statistical analysis conducted on geographies consisting of 15,626,544 people shows a weak negative correlation between the proportion of Tsimshian and percentage of population with at least associate's degree education in the United States with a correlation coefficient (R) of -0.271 and weighted average of 38.6%, a difference of 20.1%.
Associate's Degree Correlation Summary
| Measurement | English | Tsimshian |
| Minimum | 2.6% | 8.6% |
| Maximum | 88.0% | 50.0% |
| Range | 85.4% | 41.4% |
| Mean | 42.1% | 29.4% |
| Median | 43.1% | 25.2% |
| Interquartile 25% (IQ1) | 33.3% | 21.2% |
| Interquartile 75% (IQ3) | 49.2% | 39.6% |
| Interquartile Range (IQR) | 15.8% | 18.4% |
| Standard Deviation (Sample) | 14.2% | 12.0% |
| Standard Deviation (Population) | 14.2% | 11.5% |
Similar Demographics by Associate's Degree
Demographics Similar to English by Associate's Degree
In terms of associate's degree, the demographic groups most similar to English are Immigrants from Iraq (46.4%, a difference of 0.020%), Peruvian (46.4%, a difference of 0.040%), Belgian (46.3%, a difference of 0.090%), Finnish (46.3%, a difference of 0.11%), and Slovak (46.3%, a difference of 0.12%).
| Demographics | Rating | Rank | Associate's Degree |
| Immigrants | Sierra Leone | 59.2 /100 | #167 | Average 46.7% |
| Immigrants | Somalia | 55.5 /100 | #168 | Average 46.5% |
| Uruguayans | 55.4 /100 | #169 | Average 46.5% |
| Irish | 53.6 /100 | #170 | Average 46.5% |
| Basques | 52.8 /100 | #171 | Average 46.5% |
| Peruvians | 50.5 /100 | #172 | Average 46.4% |
| Immigrants | Iraq | 50.3 /100 | #173 | Average 46.4% |
| English | 50.0 /100 | #174 | Average 46.4% |
| Belgians | 48.9 /100 | #175 | Average 46.3% |
| Finns | 48.5 /100 | #176 | Average 46.3% |
| Slovaks | 48.4 /100 | #177 | Average 46.3% |
| Immigrants | Bosnia and Herzegovina | 48.3 /100 | #178 | Average 46.3% |
| Sri Lankans | 47.6 /100 | #179 | Average 46.3% |
| Bermudans | 46.4 /100 | #180 | Average 46.2% |
| Immigrants | Colombia | 41.3 /100 | #181 | Average 46.0% |
Demographics Similar to Tsimshian by Associate's Degree
In terms of associate's degree, the demographic groups most similar to Tsimshian are Chickasaw (38.6%, a difference of 0.060%), Ute (38.6%, a difference of 0.090%), Colville (38.5%, a difference of 0.15%), Cheyenne (38.7%, a difference of 0.19%), and Guatemalan (38.5%, a difference of 0.24%).
| Demographics | Rating | Rank | Associate's Degree |
| Salvadorans | 0.0 /100 | #294 | Tragic 39.0% |
| Hondurans | 0.0 /100 | #295 | Tragic 38.9% |
| Cherokee | 0.0 /100 | #296 | Tragic 38.9% |
| Cape Verdeans | 0.0 /100 | #297 | Tragic 38.8% |
| Cheyenne | 0.0 /100 | #298 | Tragic 38.7% |
| Ute | 0.0 /100 | #299 | Tragic 38.6% |
| Chickasaw | 0.0 /100 | #300 | Tragic 38.6% |
| Tsimshian | 0.0 /100 | #301 | Tragic 38.6% |
| Colville | 0.0 /100 | #302 | Tragic 38.5% |
| Guatemalans | 0.0 /100 | #303 | Tragic 38.5% |
| Sioux | 0.0 /100 | #304 | Tragic 38.5% |
| Immigrants | Honduras | 0.0 /100 | #305 | Tragic 38.5% |
| Shoshone | 0.0 /100 | #306 | Tragic 38.4% |
| Immigrants | El Salvador | 0.0 /100 | #307 | Tragic 38.4% |
| Mexican American Indians | 0.0 /100 | #308 | Tragic 38.2% |