English vs Immigrants from Yemen Associate's Degree
COMPARE
English
Immigrants from Yemen
Associate's Degree
Associate's Degree Comparison
English
Immigrants from Yemen
46.4%
ASSOCIATE'S DEGREE
50.0/ 100
METRIC RATING
174th/ 347
METRIC RANK
37.3%
ASSOCIATE'S DEGREE
0.0/ 100
METRIC RATING
321st/ 347
METRIC RANK
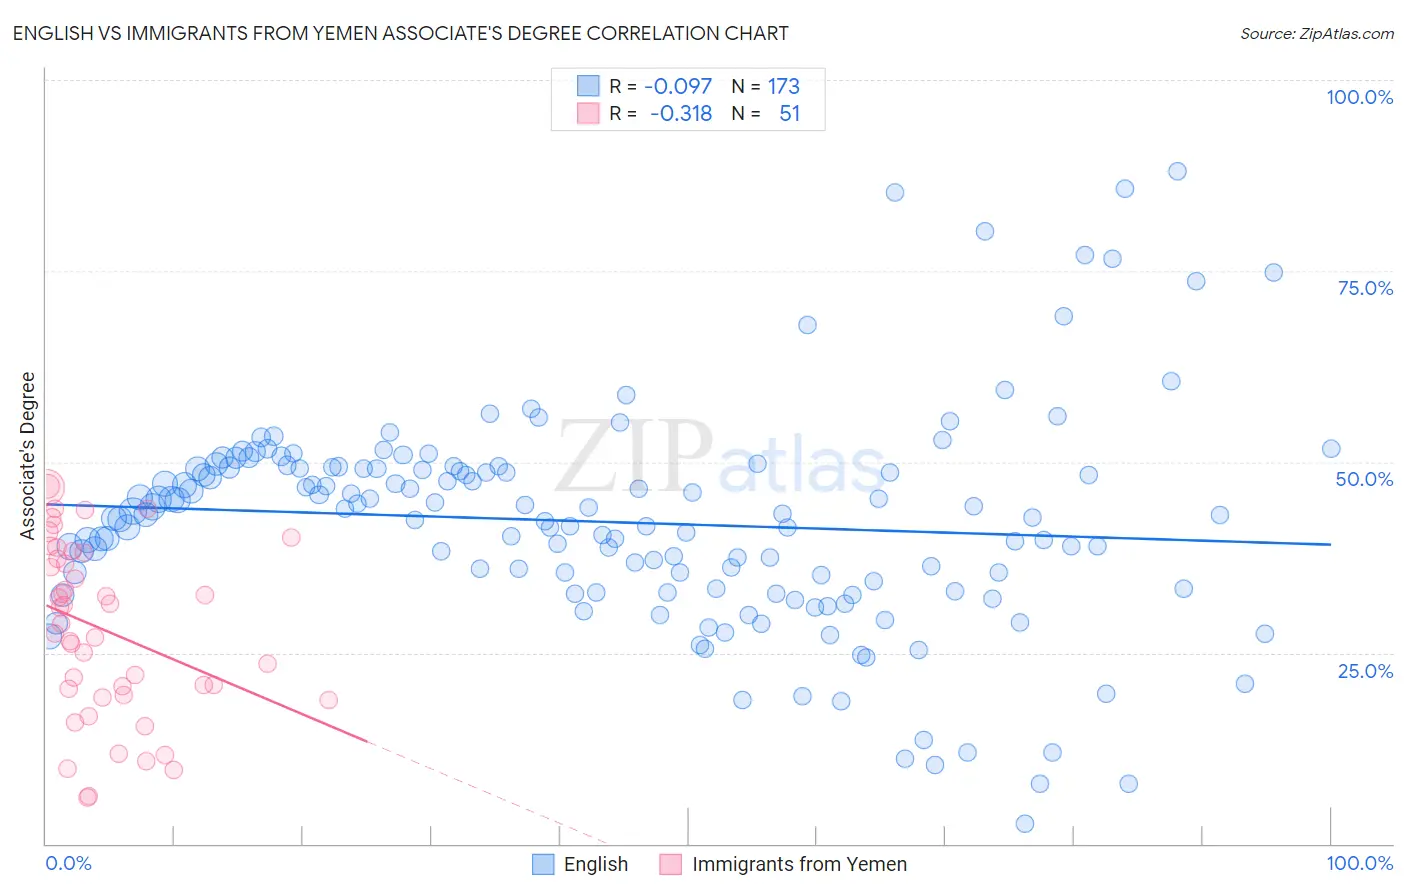
English vs Immigrants from Yemen Associate's Degree Correlation Chart
The statistical analysis conducted on geographies consisting of 579,836,667 people shows a slight negative correlation between the proportion of English and percentage of population with at least associate's degree education in the United States with a correlation coefficient (R) of -0.097 and weighted average of 46.4%. Similarly, the statistical analysis conducted on geographies consisting of 82,433,611 people shows a mild negative correlation between the proportion of Immigrants from Yemen and percentage of population with at least associate's degree education in the United States with a correlation coefficient (R) of -0.318 and weighted average of 37.3%, a difference of 24.2%.
Associate's Degree Correlation Summary
| Measurement | English | Immigrants from Yemen |
| Minimum | 2.6% | 6.0% |
| Maximum | 88.0% | 46.7% |
| Range | 85.4% | 40.7% |
| Mean | 42.1% | 28.0% |
| Median | 43.1% | 28.8% |
| Interquartile 25% (IQ1) | 33.3% | 19.5% |
| Interquartile 75% (IQ3) | 49.2% | 38.1% |
| Interquartile Range (IQR) | 15.8% | 18.6% |
| Standard Deviation (Sample) | 14.2% | 11.4% |
| Standard Deviation (Population) | 14.2% | 11.3% |
Similar Demographics by Associate's Degree
Demographics Similar to English by Associate's Degree
In terms of associate's degree, the demographic groups most similar to English are Immigrants from Iraq (46.4%, a difference of 0.020%), Peruvian (46.4%, a difference of 0.040%), Belgian (46.3%, a difference of 0.090%), Finnish (46.3%, a difference of 0.11%), and Slovak (46.3%, a difference of 0.12%).
| Demographics | Rating | Rank | Associate's Degree |
| Immigrants | Sierra Leone | 59.2 /100 | #167 | Average 46.7% |
| Immigrants | Somalia | 55.5 /100 | #168 | Average 46.5% |
| Uruguayans | 55.4 /100 | #169 | Average 46.5% |
| Irish | 53.6 /100 | #170 | Average 46.5% |
| Basques | 52.8 /100 | #171 | Average 46.5% |
| Peruvians | 50.5 /100 | #172 | Average 46.4% |
| Immigrants | Iraq | 50.3 /100 | #173 | Average 46.4% |
| English | 50.0 /100 | #174 | Average 46.4% |
| Belgians | 48.9 /100 | #175 | Average 46.3% |
| Finns | 48.5 /100 | #176 | Average 46.3% |
| Slovaks | 48.4 /100 | #177 | Average 46.3% |
| Immigrants | Bosnia and Herzegovina | 48.3 /100 | #178 | Average 46.3% |
| Sri Lankans | 47.6 /100 | #179 | Average 46.3% |
| Bermudans | 46.4 /100 | #180 | Average 46.2% |
| Immigrants | Colombia | 41.3 /100 | #181 | Average 46.0% |
Demographics Similar to Immigrants from Yemen by Associate's Degree
In terms of associate's degree, the demographic groups most similar to Immigrants from Yemen are Cajun (37.4%, a difference of 0.12%), Fijian (37.4%, a difference of 0.15%), Pennsylvania German (37.2%, a difference of 0.29%), Alaska Native (37.5%, a difference of 0.37%), and Yaqui (37.6%, a difference of 0.60%).
| Demographics | Rating | Rank | Associate's Degree |
| Seminole | 0.0 /100 | #314 | Tragic 37.7% |
| Creek | 0.0 /100 | #315 | Tragic 37.6% |
| Crow | 0.0 /100 | #316 | Tragic 37.6% |
| Yaqui | 0.0 /100 | #317 | Tragic 37.6% |
| Alaska Natives | 0.0 /100 | #318 | Tragic 37.5% |
| Fijians | 0.0 /100 | #319 | Tragic 37.4% |
| Cajuns | 0.0 /100 | #320 | Tragic 37.4% |
| Immigrants | Yemen | 0.0 /100 | #321 | Tragic 37.3% |
| Pennsylvania Germans | 0.0 /100 | #322 | Tragic 37.2% |
| Immigrants | Cabo Verde | 0.0 /100 | #323 | Tragic 36.8% |
| Arapaho | 0.0 /100 | #324 | Tragic 36.7% |
| Menominee | 0.0 /100 | #325 | Tragic 36.7% |
| Kiowa | 0.0 /100 | #326 | Tragic 36.5% |
| Dutch West Indians | 0.0 /100 | #327 | Tragic 36.5% |
| Alaskan Athabascans | 0.0 /100 | #328 | Tragic 36.5% |