Czechoslovakian vs Romanian Kindergarten

COMPARE

Czechoslovakian
Race
Ancestry
AfghanAfricanAlaska NativeAlaskan AthabascanAlbanianAleutAlsatianAmericanApacheArabArapahoArgentineanArmenianAssyrian/Chaldean/SyriacAustralianAustrianBahamianBangladeshiBarbadianBasqueBelgianBelizeanBermudanBhutaneseBlackfeetBolivianBrazilianBritishBritish West IndianBulgarianBurmeseCajunCambodianCanadianCape VerdeanCarpatho RusynCelticCentral AmericanCentral American IndianCherokeeCheyenneChickasawChileanChineseChippewaChoctawColombianColvilleComancheCosta RicanCreeCreekCroatianCrowCubanCypriotCzechCzechoslovakianDanishDelawareDominicanDutchDutch West IndianEastern EuropeanEcuadorianEgyptianEnglishEstonianEthiopianEuropeanFijianFilipinoFinnishFrenchFrench American IndianFrench CanadianGermanGerman RussianGhanaianGreekGuamanian/ChamorroGuatemalanGuyaneseHaitianHmongHonduranHopiHoumaHungarianIcelanderIndian (Asian)IndonesianInupiatIranianIraqiIrishIroquoisIsraeliItalianJamaicanJapaneseJordanianKenyanKiowaKoreanLaotianLatvianLebaneseLiberianLithuanianLumbeeLuxembourgerMacedonianMalaysianMalteseMarshalleseMenomineeMexicanMexican American IndianMongolianMoroccanNative HawaiianNavajoNepaleseNew ZealanderNicaraguanNigerianNorthern EuropeanNorwegianOkinawanOsageOttawaPaiutePakistaniPalestinianPanamanianParaguayanPennsylvania GermanPeruvianPimaPolishPortuguesePotawatomiPuebloPuerto RicanPuget Sound SalishRussianSalvadoranSamoanScandinavianScotch-IrishScottishSeminoleSenegaleseSerbianShoshoneSierra LeoneanSiouxSlavicSlovakSloveneSomaliSouth AfricanSouth AmericanSouth American IndianSoviet UnionSpaniardSpanishSpanish AmericanSpanish American IndianSri LankanSubsaharan AfricanSudaneseSwedishSwissSyrianTaiwaneseThaiTlingit-HaidaTohono O'OdhamTonganTrinidadian and TobagonianTsimshianTurkishU.S. Virgin IslanderUgandanUkrainianUruguayanUteVenezuelanVietnameseWelshWest IndianYakamaYaquiYugoslavianYumanYup'ikZimbabwean
Immigration
NonimmigrantsImmigrantsAfghanistanAfricaAlbaniaArgentinaArmeniaAsiaAustraliaAustriaBahamasBangladeshBarbadosBelarusBelgiumBelizeBoliviaBosnia and HerzegovinaBrazilBulgariaBurma/MyanmarCabo VerdeCambodiaCameroonCanadaCaribbeanCentral AmericaChileChinaColombiaCongoCosta RicaCroatiaCubaCzechoslovakiaDenmarkDominicaDominican RepublicEastern AfricaEastern AsiaEastern EuropeEcuadorEgyptEl SalvadorEnglandEritreaEthiopiaEuropeFijiFranceGermanyGhanaGreeceGrenadaGuatemalaGuyanaHaitiHondurasHong KongHungaryIndiaIndonesiaIranIraqIrelandIsraelItalyJamaicaJapanJordanKazakhstanKenyaKoreaKuwaitLaosLatin AmericaLatviaLebanonLiberiaLithuaniaMalaysiaMexicoMicronesiaMiddle AfricaMoldovaMoroccoNepalNetherlandsNicaraguaNigeriaNorth AmericaNorth MacedoniaNorthern AfricaNorthern EuropeNorwayOceaniaPakistanPanamaPeruPhilippinesPolandPortugalRomaniaRussiaSaudi ArabiaScotlandSenegalSerbiaSierra LeoneSingaporeSomaliaSouth AfricaSouth AmericaSouth Central AsiaSouth Eastern AsiaSouthern EuropeSpainSri LankaSt. Vincent and the GrenadinesSudanSwedenSwitzerlandSyriaTaiwanThailandTrinidad and TobagoTurkeyUgandaUkraineUruguayUzbekistanVenezuelaVietnamWest IndiesWestern AfricaWestern AsiaWestern EuropeYemenZaireZimbabweAzores
Romanian
Race
Ancestry
AfghanAfricanAlaska NativeAlaskan AthabascanAlbanianAleutAlsatianAmericanApacheArabArapahoArgentineanArmenianAssyrian/Chaldean/SyriacAustralianAustrianBahamianBangladeshiBarbadianBasqueBelgianBelizeanBermudanBhutaneseBlackfeetBolivianBrazilianBritishBritish West IndianBulgarianBurmeseCajunCambodianCanadianCape VerdeanCarpatho RusynCelticCentral AmericanCentral American IndianCherokeeCheyenneChickasawChileanChineseChippewaChoctawColombianColvilleComancheCosta RicanCreeCreekCroatianCrowCubanCypriotCzechDanishDelawareDominicanDutchDutch West IndianEastern EuropeanEcuadorianEgyptianEnglishEstonianEthiopianEuropeanFijianFilipinoFinnishFrenchFrench American IndianFrench CanadianGermanGerman RussianGhanaianGreekGuamanian/ChamorroGuatemalanGuyaneseHaitianHmongHonduranHopiHoumaHungarianIcelanderIndian (Asian)IndonesianInupiatIranianIraqiIrishIroquoisIsraeliItalianJamaicanJapaneseJordanianKenyanKiowaKoreanLaotianLatvianLebaneseLiberianLithuanianLumbeeLuxembourgerMacedonianMalaysianMalteseMarshalleseMenomineeMexicanMexican American IndianMongolianMoroccanNative HawaiianNavajoNepaleseNew ZealanderNicaraguanNigerianNorthern EuropeanNorwegianOkinawanOsageOttawaPaiutePakistaniPalestinianPanamanianParaguayanPennsylvania GermanPeruvianPimaPolishPortuguesePotawatomiPuebloPuerto RicanPuget Sound SalishRomanianRussianSalvadoranSamoanScandinavianScotch-IrishScottishSeminoleSenegaleseSerbianShoshoneSierra LeoneanSiouxSlavicSlovakSloveneSomaliSouth AfricanSouth AmericanSouth American IndianSoviet UnionSpaniardSpanishSpanish AmericanSpanish American IndianSri LankanSubsaharan AfricanSudaneseSwedishSwissSyrianTaiwaneseThaiTlingit-HaidaTohono O'OdhamTonganTrinidadian and TobagonianTsimshianTurkishU.S. Virgin IslanderUgandanUkrainianUruguayanUteVenezuelanVietnameseWelshWest IndianYakamaYaquiYugoslavianYumanYup'ikZimbabwean
Immigration
NonimmigrantsImmigrantsAfghanistanAfricaAlbaniaArgentinaArmeniaAsiaAustraliaAustriaBahamasBangladeshBarbadosBelarusBelgiumBelizeBoliviaBosnia and HerzegovinaBrazilBulgariaBurma/MyanmarCabo VerdeCambodiaCameroonCanadaCaribbeanCentral AmericaChileChinaColombiaCongoCosta RicaCroatiaCubaCzechoslovakiaDenmarkDominicaDominican RepublicEastern AfricaEastern AsiaEastern EuropeEcuadorEgyptEl SalvadorEnglandEritreaEthiopiaEuropeFijiFranceGermanyGhanaGreeceGrenadaGuatemalaGuyanaHaitiHondurasHong KongHungaryIndiaIndonesiaIranIraqIrelandIsraelItalyJamaicaJapanJordanKazakhstanKenyaKoreaKuwaitLaosLatin AmericaLatviaLebanonLiberiaLithuaniaMalaysiaMexicoMicronesiaMiddle AfricaMoldovaMoroccoNepalNetherlandsNicaraguaNigeriaNorth AmericaNorth MacedoniaNorthern AfricaNorthern EuropeNorwayOceaniaPakistanPanamaPeruPhilippinesPolandPortugalRomaniaRussiaSaudi ArabiaScotlandSenegalSerbiaSierra LeoneSingaporeSomaliaSouth AfricaSouth AmericaSouth Central AsiaSouth Eastern AsiaSouthern EuropeSpainSri LankaSt. Vincent and the GrenadinesSudanSwedenSwitzerlandSyriaTaiwanThailandTrinidad and TobagoTurkeyUgandaUkraineUruguayUzbekistanVenezuelaVietnamWest IndiesWestern AfricaWestern AsiaWestern EuropeYemenZaireZimbabweAzores
Kindergarten
Income
Poverty
Unemployment
Labor Participation
Family Structure
Vehicle Availability
Education Level
Disability

Kindergarten Comparison

Czechoslovakians

Romanians

Exceptional
Exceptional
98.4%
KINDERGARTEN
99.8/ 100
METRIC RATING
47th/ 347
METRIC RANK
98.2%
KINDERGARTEN
97.8/ 100
METRIC RATING
101st/ 347
METRIC RANK

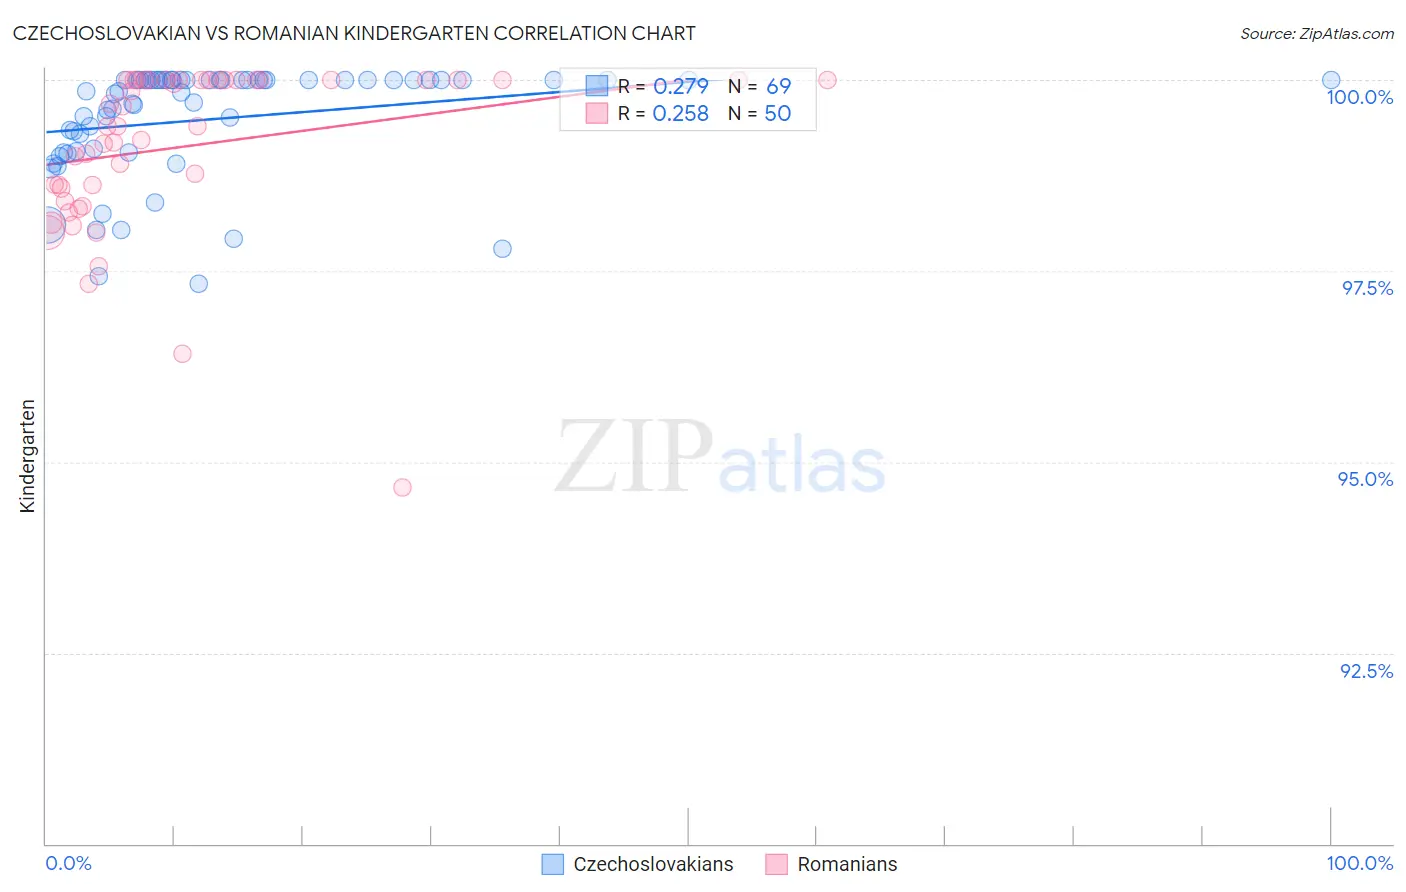
Czechoslovakian vs Romanian Kindergarten Correlation Chart

The statistical analysis conducted on geographies consisting of 368,668,876 people shows a weak positive correlation between the proportion of Czechoslovakians and percentage of population with at least kindergarten education in the United States with a correlation coefficient (R) of 0.279 and weighted average of 98.4%. Similarly, the statistical analysis conducted on geographies consisting of 377,904,438 people shows a weak positive correlation between the proportion of Romanians and percentage of population with at least kindergarten education in the United States with a correlation coefficient (R) of 0.258 and weighted average of 98.2%, a difference of 0.20%.
Czechoslovakian vs Romanian Kindergarten

Kindergarten Correlation Summary

MeasurementCzechoslovakianRomanian
Minimum97.3%94.7%
Maximum100.0%100.0%
Range2.7%5.3%
Mean99.5%99.1%
Median99.9%99.4%
Interquartile 25% (IQ1)99.1%98.6%
Interquartile 75% (IQ3)100.0%100.0%
Interquartile Range (IQR)0.94%1.4%
Standard Deviation (Sample)0.72%1.1%
Standard Deviation (Population)0.72%1.1%

Similar Demographics by Kindergarten

Demographics Similar to Czechoslovakians by Kindergarten

In terms of kindergarten, the demographic groups most similar to Czechoslovakians are Ottawa (98.4%, a difference of 0.0%), Hungarian (98.5%, a difference of 0.010%), Kiowa (98.4%, a difference of 0.010%), White/Caucasian (98.4%, a difference of 0.010%), and Estonian (98.4%, a difference of 0.010%).
DemographicsRating | RankKindergarten
Luxembourgers
99.9
/100
|
#40
Exceptional
98.5%
Eastern Europeans
99.9
/100
|
#41
Exceptional
98.5%
Native Hawaiians
99.9
/100
|
#42
Exceptional
98.5%
Lumbee
99.9
/100
|
#43
Exceptional
98.5%
Northern Europeans
99.9
/100
|
#44
Exceptional
98.5%
Belgians
99.9
/100
|
#45
Exceptional
98.5%
Hungarians
99.9
/100
|
#46
Exceptional
98.5%
Czechoslovakians
99.8
/100
|
#47
Exceptional
98.4%
Ottawa
99.8
/100
|
#48
Exceptional
98.4%
Kiowa
99.8
/100
|
#49
Exceptional
98.4%
Whites/Caucasians
99.8
/100
|
#50
Exceptional
98.4%
Estonians
99.8
/100
|
#51
Exceptional
98.4%
Australians
99.8
/100
|
#52
Exceptional
98.4%
Celtics
99.8
/100
|
#53
Exceptional
98.4%
Pueblo
99.8
/100
|
#54
Exceptional
98.4%

Demographics Similar to Romanians by Kindergarten

In terms of kindergarten, the demographic groups most similar to Romanians are Cree (98.2%, a difference of 0.0%), Puget Sound Salish (98.2%, a difference of 0.010%), Immigrants from Ireland (98.2%, a difference of 0.010%), Bhutanese (98.2%, a difference of 0.010%), and Nonimmigrants (98.3%, a difference of 0.020%).
DemographicsRating | RankKindergarten
South Africans
98.5
/100
|
#94
Exceptional
98.3%
Immigrants | Germany
98.5
/100
|
#95
Exceptional
98.3%
Immigrants | Nonimmigrants
98.3
/100
|
#96
Exceptional
98.3%
Cypriots
98.3
/100
|
#97
Exceptional
98.3%
Choctaw
98.2
/100
|
#98
Exceptional
98.3%
Colville
98.2
/100
|
#99
Exceptional
98.3%
Puget Sound Salish
98.1
/100
|
#100
Exceptional
98.2%
Romanians
97.8
/100
|
#101
Exceptional
98.2%
Cree
97.7
/100
|
#102
Exceptional
98.2%
Immigrants | Ireland
97.6
/100
|
#103
Exceptional
98.2%
Bhutanese
97.3
/100
|
#104
Exceptional
98.2%
Pima
97.3
/100
|
#105
Exceptional
98.2%
Basques
97.3
/100
|
#106
Exceptional
98.2%
Turks
97.3
/100
|
#107
Exceptional
98.2%
Immigrants | Switzerland
97.2
/100
|
#108
Exceptional
98.2%