Czechoslovakian vs Immigrants from Netherlands 10th Grade
COMPARE
Czechoslovakian
Immigrants from Netherlands
10th Grade
10th Grade Comparison
Czechoslovakians
Immigrants from Netherlands
95.1%
10TH GRADE
99.9/ 100
METRIC RATING
46th/ 347
METRIC RANK
94.9%
10TH GRADE
99.7/ 100
METRIC RATING
67th/ 347
METRIC RANK
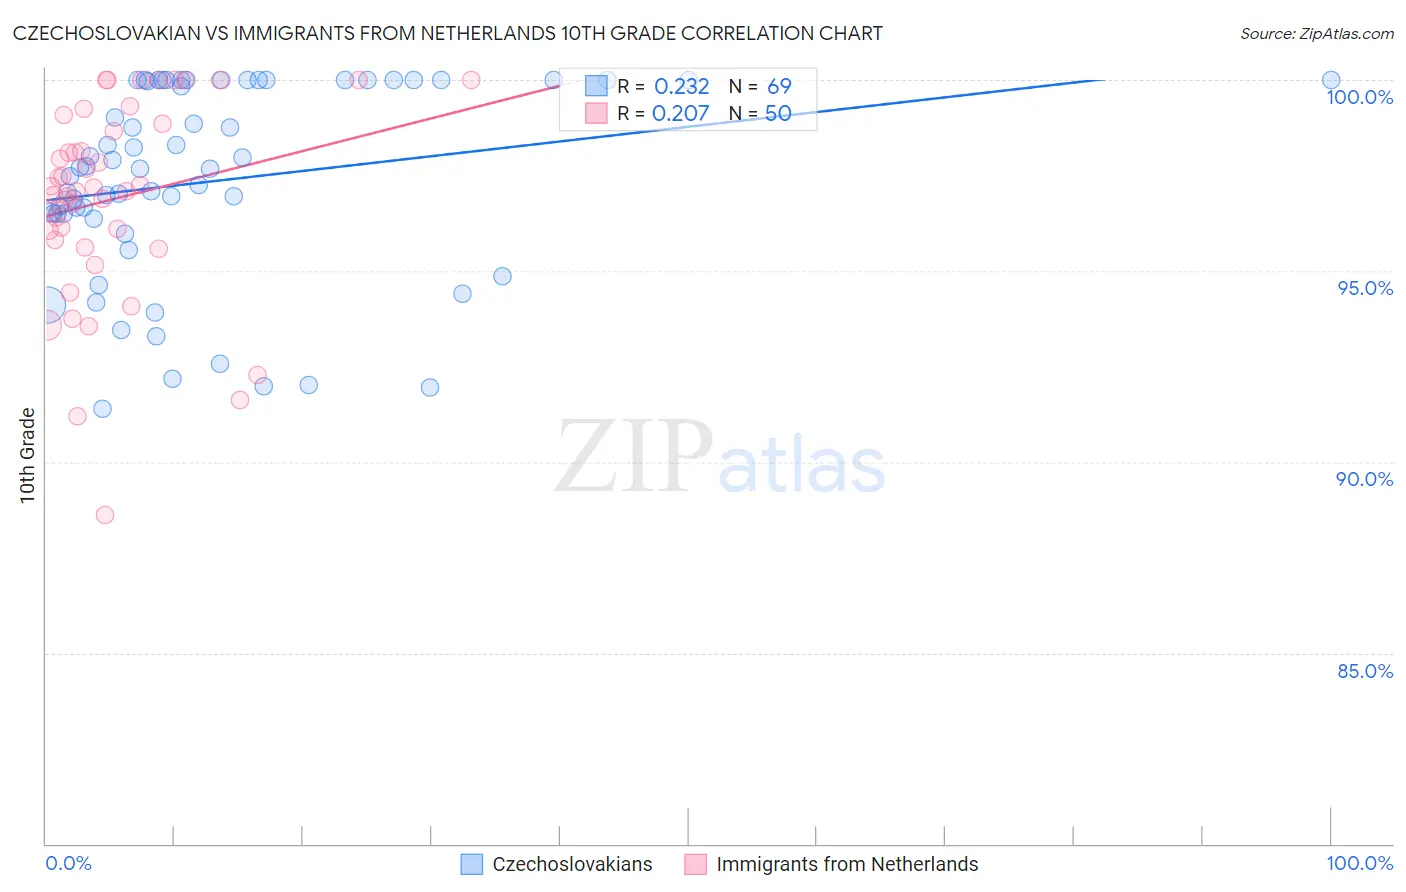
Czechoslovakian vs Immigrants from Netherlands 10th Grade Correlation Chart
The statistical analysis conducted on geographies consisting of 368,668,876 people shows a weak positive correlation between the proportion of Czechoslovakians and percentage of population with at least 10th grade education in the United States with a correlation coefficient (R) of 0.232 and weighted average of 95.1%. Similarly, the statistical analysis conducted on geographies consisting of 237,869,934 people shows a weak positive correlation between the proportion of Immigrants from Netherlands and percentage of population with at least 10th grade education in the United States with a correlation coefficient (R) of 0.207 and weighted average of 94.9%, a difference of 0.24%.
10th Grade Correlation Summary
| Measurement | Czechoslovakian | Immigrants from Netherlands |
| Minimum | 91.4% | 88.6% |
| Maximum | 100.0% | 100.0% |
| Range | 8.6% | 11.4% |
| Mean | 97.4% | 96.9% |
| Median | 97.7% | 97.1% |
| Interquartile 25% (IQ1) | 96.4% | 95.8% |
| Interquartile 75% (IQ3) | 100.0% | 98.8% |
| Interquartile Range (IQR) | 3.6% | 3.0% |
| Standard Deviation (Sample) | 2.5% | 2.6% |
| Standard Deviation (Population) | 2.5% | 2.5% |
Similar Demographics by 10th Grade
Demographics Similar to Czechoslovakians by 10th Grade
In terms of 10th grade, the demographic groups most similar to Czechoslovakians are Immigrants from Northern Europe (95.2%, a difference of 0.010%), Greek (95.2%, a difference of 0.010%), Serbian (95.1%, a difference of 0.010%), Macedonian (95.2%, a difference of 0.020%), and Australian (95.1%, a difference of 0.020%).
| Demographics | Rating | Rank | 10th Grade |
| Immigrants | Scotland | 99.9 /100 | #39 | Exceptional 95.2% |
| Scotch-Irish | 99.9 /100 | #40 | Exceptional 95.2% |
| Russians | 99.9 /100 | #41 | Exceptional 95.2% |
| Slavs | 99.9 /100 | #42 | Exceptional 95.2% |
| Macedonians | 99.9 /100 | #43 | Exceptional 95.2% |
| Immigrants | Northern Europe | 99.9 /100 | #44 | Exceptional 95.2% |
| Greeks | 99.9 /100 | #45 | Exceptional 95.2% |
| Czechoslovakians | 99.9 /100 | #46 | Exceptional 95.1% |
| Serbians | 99.9 /100 | #47 | Exceptional 95.1% |
| Australians | 99.9 /100 | #48 | Exceptional 95.1% |
| Immigrants | Austria | 99.9 /100 | #49 | Exceptional 95.1% |
| Immigrants | Canada | 99.8 /100 | #50 | Exceptional 95.1% |
| Austrians | 99.8 /100 | #51 | Exceptional 95.1% |
| Ottawa | 99.8 /100 | #52 | Exceptional 95.1% |
| Immigrants | North America | 99.8 /100 | #53 | Exceptional 95.0% |
Demographics Similar to Immigrants from Netherlands by 10th Grade
In terms of 10th grade, the demographic groups most similar to Immigrants from Netherlands are Immigrants from Australia (94.9%, a difference of 0.0%), Immigrants from Belgium (94.9%, a difference of 0.0%), Immigrants from England (94.9%, a difference of 0.020%), Zimbabwean (94.9%, a difference of 0.030%), and Alaska Native (94.9%, a difference of 0.030%).
| Demographics | Rating | Rank | 10th Grade |
| Cypriots | 99.8 /100 | #60 | Exceptional 95.0% |
| Chippewa | 99.8 /100 | #61 | Exceptional 95.0% |
| Thais | 99.8 /100 | #62 | Exceptional 95.0% |
| Immigrants | Singapore | 99.8 /100 | #63 | Exceptional 95.0% |
| Native Hawaiians | 99.7 /100 | #64 | Exceptional 95.0% |
| Turks | 99.7 /100 | #65 | Exceptional 95.0% |
| Immigrants | Australia | 99.7 /100 | #66 | Exceptional 94.9% |
| Immigrants | Netherlands | 99.7 /100 | #67 | Exceptional 94.9% |
| Immigrants | Belgium | 99.7 /100 | #68 | Exceptional 94.9% |
| Immigrants | England | 99.6 /100 | #69 | Exceptional 94.9% |
| Zimbabweans | 99.6 /100 | #70 | Exceptional 94.9% |
| Alaska Natives | 99.6 /100 | #71 | Exceptional 94.9% |
| Immigrants | Sweden | 99.6 /100 | #72 | Exceptional 94.9% |
| Bhutanese | 99.6 /100 | #73 | Exceptional 94.9% |
| Canadians | 99.6 /100 | #74 | Exceptional 94.9% |