Czechoslovakian vs Immigrants from Cabo Verde 10th Grade

COMPARE

Czechoslovakian
Race
Ancestry
AfghanAfricanAlaska NativeAlaskan AthabascanAlbanianAleutAlsatianAmericanApacheArabArapahoArgentineanArmenianAssyrian/Chaldean/SyriacAustralianAustrianBahamianBangladeshiBarbadianBasqueBelgianBelizeanBermudanBhutaneseBlackfeetBolivianBrazilianBritishBritish West IndianBulgarianBurmeseCajunCambodianCanadianCape VerdeanCarpatho RusynCelticCentral AmericanCentral American IndianCherokeeCheyenneChickasawChileanChineseChippewaChoctawColombianColvilleComancheCosta RicanCreeCreekCroatianCrowCubanCypriotCzechCzechoslovakianDanishDelawareDominicanDutchDutch West IndianEastern EuropeanEcuadorianEgyptianEnglishEstonianEthiopianEuropeanFijianFilipinoFinnishFrenchFrench American IndianFrench CanadianGermanGerman RussianGhanaianGreekGuamanian/ChamorroGuatemalanGuyaneseHaitianHmongHonduranHopiHoumaHungarianIcelanderIndian (Asian)IndonesianInupiatIranianIraqiIrishIroquoisIsraeliItalianJamaicanJapaneseJordanianKenyanKiowaKoreanLaotianLatvianLebaneseLiberianLithuanianLumbeeLuxembourgerMacedonianMalaysianMalteseMarshalleseMenomineeMexicanMexican American IndianMongolianMoroccanNative HawaiianNavajoNepaleseNew ZealanderNicaraguanNigerianNorthern EuropeanNorwegianOkinawanOsageOttawaPaiutePakistaniPalestinianPanamanianParaguayanPennsylvania GermanPeruvianPimaPolishPortuguesePotawatomiPuebloPuerto RicanPuget Sound SalishRomanianRussianSalvadoranSamoanScandinavianScotch-IrishScottishSeminoleSenegaleseSerbianShoshoneSierra LeoneanSiouxSlavicSlovakSloveneSomaliSouth AfricanSouth AmericanSouth American IndianSoviet UnionSpaniardSpanishSpanish AmericanSpanish American IndianSri LankanSubsaharan AfricanSudaneseSwedishSwissSyrianTaiwaneseThaiTlingit-HaidaTohono O'OdhamTonganTrinidadian and TobagonianTsimshianTurkishU.S. Virgin IslanderUgandanUkrainianUruguayanUteVenezuelanVietnameseWelshWest IndianYakamaYaquiYugoslavianYumanYup'ikZimbabwean
Immigration
NonimmigrantsImmigrantsAfghanistanAfricaAlbaniaArgentinaArmeniaAsiaAustraliaAustriaBahamasBangladeshBarbadosBelarusBelgiumBelizeBoliviaBosnia and HerzegovinaBrazilBulgariaBurma/MyanmarCambodiaCameroonCanadaCaribbeanCentral AmericaChileChinaColombiaCongoCosta RicaCroatiaCubaCzechoslovakiaDenmarkDominicaDominican RepublicEastern AfricaEastern AsiaEastern EuropeEcuadorEgyptEl SalvadorEnglandEritreaEthiopiaEuropeFijiFranceGermanyGhanaGreeceGrenadaGuatemalaGuyanaHaitiHondurasHong KongHungaryIndiaIndonesiaIranIraqIrelandIsraelItalyJamaicaJapanJordanKazakhstanKenyaKoreaKuwaitLaosLatin AmericaLatviaLebanonLiberiaLithuaniaMalaysiaMexicoMicronesiaMiddle AfricaMoldovaMoroccoNepalNetherlandsNicaraguaNigeriaNorth AmericaNorth MacedoniaNorthern AfricaNorthern EuropeNorwayOceaniaPakistanPanamaPeruPhilippinesPolandPortugalRomaniaRussiaSaudi ArabiaScotlandSenegalSerbiaSierra LeoneSingaporeSomaliaSouth AfricaSouth AmericaSouth Central AsiaSouth Eastern AsiaSouthern EuropeSpainSri LankaSt. Vincent and the GrenadinesSudanSwedenSwitzerlandSyriaTaiwanThailandTrinidad and TobagoTurkeyUgandaUkraineUruguayUzbekistanVenezuelaVietnamWest IndiesWestern AfricaWestern AsiaWestern EuropeYemenZaireZimbabweAzores
Immigrants from Cabo Verde
Race
Ancestry
AfghanAfricanAlaska NativeAlaskan AthabascanAlbanianAleutAlsatianAmericanApacheArabArapahoArgentineanArmenianAssyrian/Chaldean/SyriacAustralianAustrianBahamianBangladeshiBarbadianBasqueBelgianBelizeanBermudanBhutaneseBlackfeetBolivianBrazilianBritishBritish West IndianBulgarianBurmeseCajunCambodianCanadianCape VerdeanCarpatho RusynCelticCentral AmericanCentral American IndianCherokeeCheyenneChickasawChileanChineseChippewaChoctawColombianColvilleComancheCosta RicanCreeCreekCroatianCrowCubanCypriotCzechDanishDelawareDominicanDutchDutch West IndianEastern EuropeanEcuadorianEgyptianEnglishEstonianEthiopianEuropeanFijianFilipinoFinnishFrenchFrench American IndianFrench CanadianGermanGerman RussianGhanaianGreekGuamanian/ChamorroGuatemalanGuyaneseHaitianHmongHonduranHopiHoumaHungarianIcelanderIndian (Asian)IndonesianInupiatIranianIraqiIrishIroquoisIsraeliItalianJamaicanJapaneseJordanianKenyanKiowaKoreanLaotianLatvianLebaneseLiberianLithuanianLumbeeLuxembourgerMacedonianMalaysianMalteseMarshalleseMenomineeMexicanMexican American IndianMongolianMoroccanNative HawaiianNavajoNepaleseNew ZealanderNicaraguanNigerianNorthern EuropeanNorwegianOkinawanOsageOttawaPaiutePakistaniPalestinianPanamanianParaguayanPennsylvania GermanPeruvianPimaPolishPortuguesePotawatomiPuebloPuerto RicanPuget Sound SalishRomanianRussianSalvadoranSamoanScandinavianScotch-IrishScottishSeminoleSenegaleseSerbianShoshoneSierra LeoneanSiouxSlavicSlovakSloveneSomaliSouth AfricanSouth AmericanSouth American IndianSoviet UnionSpaniardSpanishSpanish AmericanSpanish American IndianSri LankanSubsaharan AfricanSudaneseSwedishSwissSyrianTaiwaneseThaiTlingit-HaidaTohono O'OdhamTonganTrinidadian and TobagonianTsimshianTurkishU.S. Virgin IslanderUgandanUkrainianUruguayanUteVenezuelanVietnameseWelshWest IndianYakamaYaquiYugoslavianYumanYup'ikZimbabwean
Immigration
NonimmigrantsImmigrantsAfghanistanAfricaAlbaniaArgentinaArmeniaAsiaAustraliaAustriaBahamasBangladeshBarbadosBelarusBelgiumBelizeBoliviaBosnia and HerzegovinaBrazilBulgariaBurma/MyanmarCabo VerdeCambodiaCameroonCanadaCaribbeanCentral AmericaChileChinaColombiaCongoCosta RicaCroatiaCubaCzechoslovakiaDenmarkDominicaDominican RepublicEastern AfricaEastern AsiaEastern EuropeEcuadorEgyptEl SalvadorEnglandEritreaEthiopiaEuropeFijiFranceGermanyGhanaGreeceGrenadaGuatemalaGuyanaHaitiHondurasHong KongHungaryIndiaIndonesiaIranIraqIrelandIsraelItalyJamaicaJapanJordanKazakhstanKenyaKoreaKuwaitLaosLatin AmericaLatviaLebanonLiberiaLithuaniaMalaysiaMexicoMicronesiaMiddle AfricaMoldovaMoroccoNepalNetherlandsNicaraguaNigeriaNorth AmericaNorth MacedoniaNorthern AfricaNorthern EuropeNorwayOceaniaPakistanPanamaPeruPhilippinesPolandPortugalRomaniaRussiaSaudi ArabiaScotlandSenegalSerbiaSierra LeoneSingaporeSomaliaSouth AfricaSouth AmericaSouth Central AsiaSouth Eastern AsiaSouthern EuropeSpainSri LankaSt. Vincent and the GrenadinesSudanSwedenSwitzerlandSyriaTaiwanThailandTrinidad and TobagoTurkeyUgandaUkraineUruguayUzbekistanVenezuelaVietnamWest IndiesWestern AfricaWestern AsiaWestern EuropeYemenZaireZimbabweAzores
10th Grade
Income
Poverty
Unemployment
Labor Participation
Family Structure
Vehicle Availability
Education Level
Disability

10th Grade Comparison

Czechoslovakians

Immigrants from Cabo Verde

Exceptional
Tragic
95.1%
10TH GRADE
99.9/ 100
METRIC RATING
46th/ 347
METRIC RANK
89.5%
10TH GRADE
0.0/ 100
METRIC RATING
328th/ 347
METRIC RANK

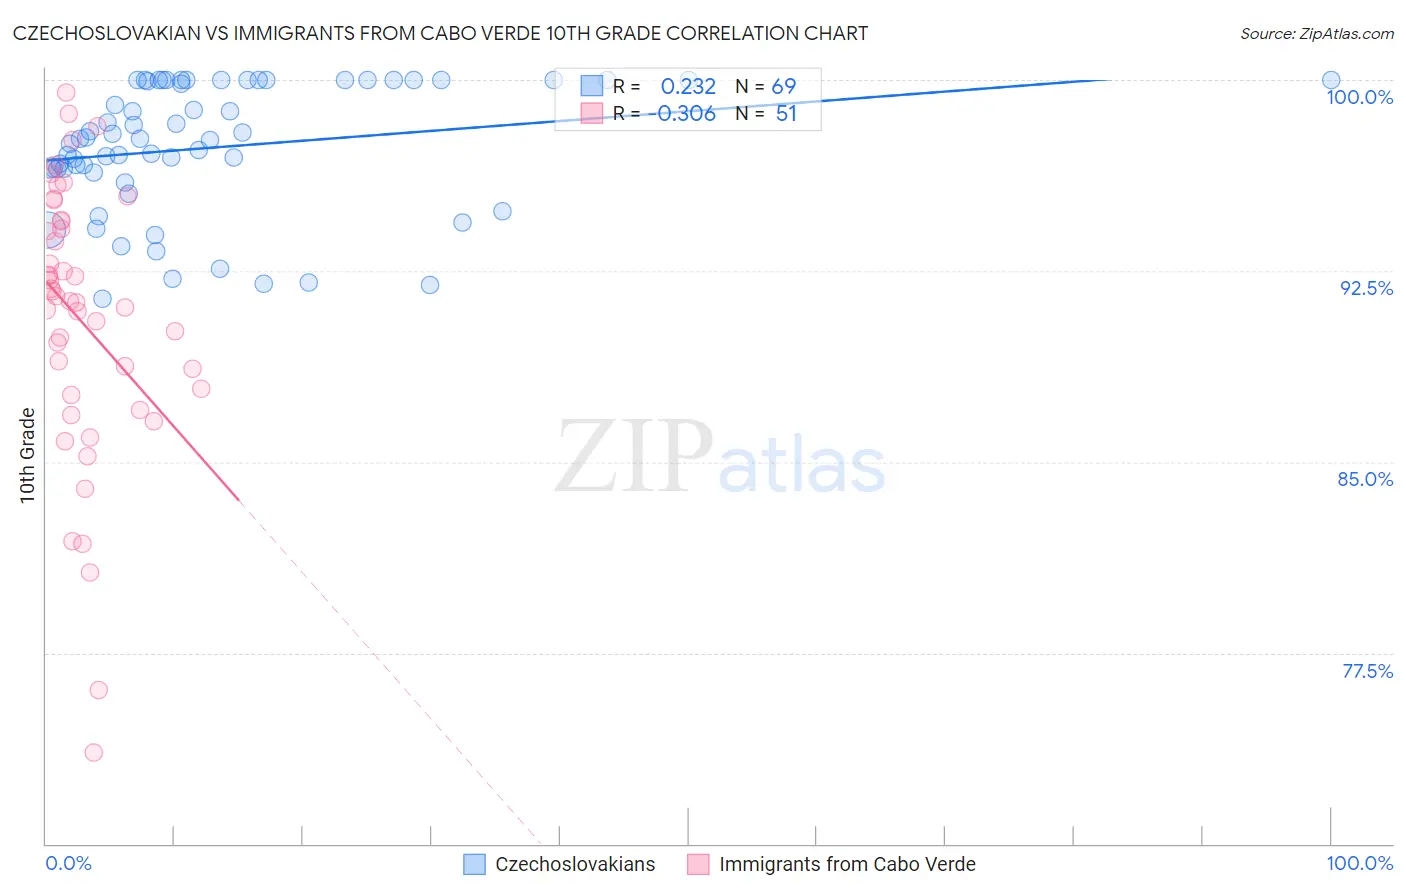
Czechoslovakian vs Immigrants from Cabo Verde 10th Grade Correlation Chart

The statistical analysis conducted on geographies consisting of 368,668,876 people shows a weak positive correlation between the proportion of Czechoslovakians and percentage of population with at least 10th grade education in the United States with a correlation coefficient (R) of 0.232 and weighted average of 95.1%. Similarly, the statistical analysis conducted on geographies consisting of 38,158,316 people shows a mild negative correlation between the proportion of Immigrants from Cabo Verde and percentage of population with at least 10th grade education in the United States with a correlation coefficient (R) of -0.306 and weighted average of 89.5%, a difference of 6.4%.
Czechoslovakian vs Immigrants from Cabo Verde 10th Grade

10th Grade Correlation Summary

MeasurementCzechoslovakianImmigrants from Cabo Verde
Minimum91.4%73.6%
Maximum100.0%99.5%
Range8.6%25.9%
Mean97.4%90.6%
Median97.7%91.3%
Interquartile 25% (IQ1)96.4%87.6%
Interquartile 75% (IQ3)100.0%94.5%
Interquartile Range (IQR)3.6%6.8%
Standard Deviation (Sample)2.5%5.4%
Standard Deviation (Population)2.5%5.4%

Similar Demographics by 10th Grade

Demographics Similar to Czechoslovakians by 10th Grade

In terms of 10th grade, the demographic groups most similar to Czechoslovakians are Immigrants from Northern Europe (95.2%, a difference of 0.010%), Greek (95.2%, a difference of 0.010%), Serbian (95.1%, a difference of 0.010%), Macedonian (95.2%, a difference of 0.020%), and Australian (95.1%, a difference of 0.020%).
DemographicsRating | Rank10th Grade
Immigrants | Scotland
99.9
/100
|
#39
Exceptional
95.2%
Scotch-Irish
99.9
/100
|
#40
Exceptional
95.2%
Russians
99.9
/100
|
#41
Exceptional
95.2%
Slavs
99.9
/100
|
#42
Exceptional
95.2%
Macedonians
99.9
/100
|
#43
Exceptional
95.2%
Immigrants | Northern Europe
99.9
/100
|
#44
Exceptional
95.2%
Greeks
99.9
/100
|
#45
Exceptional
95.2%
Czechoslovakians
99.9
/100
|
#46
Exceptional
95.1%
Serbians
99.9
/100
|
#47
Exceptional
95.1%
Australians
99.9
/100
|
#48
Exceptional
95.1%
Immigrants | Austria
99.9
/100
|
#49
Exceptional
95.1%
Immigrants | Canada
99.8
/100
|
#50
Exceptional
95.1%
Austrians
99.8
/100
|
#51
Exceptional
95.1%
Ottawa
99.8
/100
|
#52
Exceptional
95.1%
Immigrants | North America
99.8
/100
|
#53
Exceptional
95.0%

Demographics Similar to Immigrants from Cabo Verde by 10th Grade

In terms of 10th grade, the demographic groups most similar to Immigrants from Cabo Verde are Immigrants from Nicaragua (89.5%, a difference of 0.010%), Dominican (89.4%, a difference of 0.10%), Central American Indian (89.7%, a difference of 0.27%), Puerto Rican (89.8%, a difference of 0.44%), and Immigrants from Yemen (89.1%, a difference of 0.45%).
DemographicsRating | Rank10th Grade
Belizeans
0.0
/100
|
#321
Tragic
90.2%
Tohono O'odham
0.0
/100
|
#322
Tragic
90.1%
Immigrants | Belize
0.0
/100
|
#323
Tragic
90.1%
Immigrants | Armenia
0.0
/100
|
#324
Tragic
89.9%
Puerto Ricans
0.0
/100
|
#325
Tragic
89.8%
Central American Indians
0.0
/100
|
#326
Tragic
89.7%
Immigrants | Nicaragua
0.0
/100
|
#327
Tragic
89.5%
Immigrants | Cabo Verde
0.0
/100
|
#328
Tragic
89.5%
Dominicans
0.0
/100
|
#329
Tragic
89.4%
Immigrants | Yemen
0.0
/100
|
#330
Tragic
89.1%
Mexican American Indians
0.0
/100
|
#331
Tragic
89.0%
Immigrants | Azores
0.0
/100
|
#332
Tragic
89.0%
Hondurans
0.0
/100
|
#333
Tragic
89.0%
Hispanics or Latinos
0.0
/100
|
#334
Tragic
88.9%
Immigrants | Dominican Republic
0.0
/100
|
#335
Tragic
88.7%