Czechoslovakian vs Immigrants from Jamaica Doctorate Degree
COMPARE
Czechoslovakian
Immigrants from Jamaica
Doctorate Degree
Doctorate Degree Comparison
Czechoslovakians
Immigrants from Jamaica
1.8%
DOCTORATE DEGREE
33.0/ 100
METRIC RATING
187th/ 347
METRIC RANK
1.4%
DOCTORATE DEGREE
0.1/ 100
METRIC RATING
310th/ 347
METRIC RANK
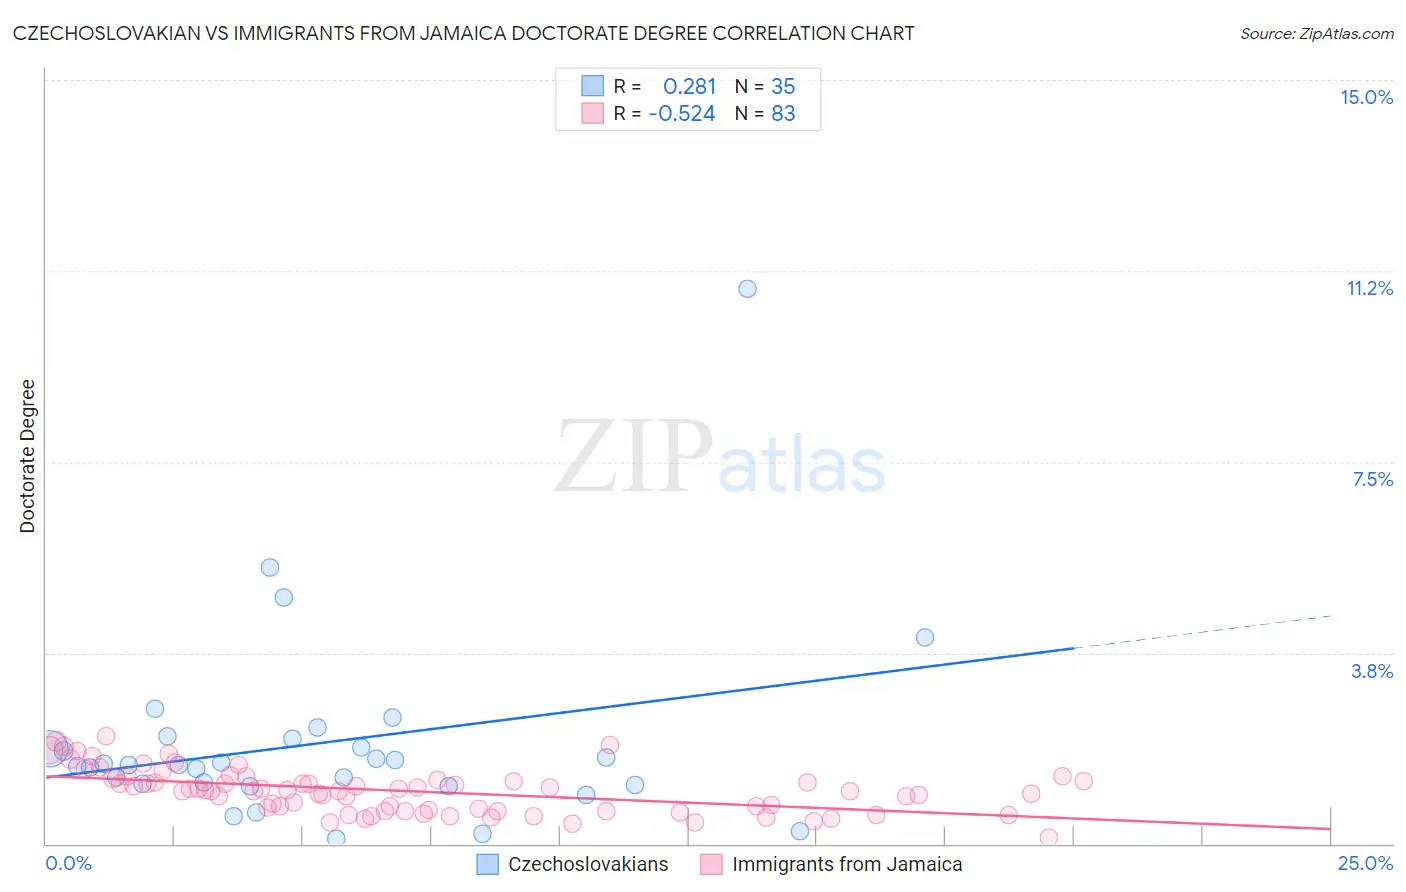
Czechoslovakian vs Immigrants from Jamaica Doctorate Degree Correlation Chart
The statistical analysis conducted on geographies consisting of 364,136,650 people shows a weak positive correlation between the proportion of Czechoslovakians and percentage of population with at least doctorate degree education in the United States with a correlation coefficient (R) of 0.281 and weighted average of 1.8%. Similarly, the statistical analysis conducted on geographies consisting of 299,587,727 people shows a substantial negative correlation between the proportion of Immigrants from Jamaica and percentage of population with at least doctorate degree education in the United States with a correlation coefficient (R) of -0.524 and weighted average of 1.4%, a difference of 31.1%.
Doctorate Degree Correlation Summary
| Measurement | Czechoslovakian | Immigrants from Jamaica |
| Minimum | 0.10% | 0.12% |
| Maximum | 10.9% | 2.1% |
| Range | 10.8% | 2.0% |
| Mean | 2.0% | 1.0% |
| Median | 1.6% | 1.0% |
| Interquartile 25% (IQ1) | 1.1% | 0.64% |
| Interquartile 75% (IQ3) | 2.1% | 1.3% |
| Interquartile Range (IQR) | 0.92% | 0.62% |
| Standard Deviation (Sample) | 1.9% | 0.43% |
| Standard Deviation (Population) | 1.9% | 0.43% |
Similar Demographics by Doctorate Degree
Demographics Similar to Czechoslovakians by Doctorate Degree
In terms of doctorate degree, the demographic groups most similar to Czechoslovakians are Peruvian (1.8%, a difference of 0.23%), German (1.8%, a difference of 0.45%), French Canadian (1.8%, a difference of 0.49%), Immigrants from Costa Rica (1.8%, a difference of 0.50%), and Slovak (1.8%, a difference of 0.55%).
| Demographics | Rating | Rank | Doctorate Degree |
| Scandinavians | 48.0 /100 | #180 | Average 1.8% |
| Immigrants | Immigrants | 46.2 /100 | #181 | Average 1.8% |
| Immigrants | Afghanistan | 44.3 /100 | #182 | Average 1.8% |
| Finns | 42.1 /100 | #183 | Average 1.8% |
| Nigerians | 39.9 /100 | #184 | Fair 1.8% |
| Slovaks | 36.4 /100 | #185 | Fair 1.8% |
| Peruvians | 34.4 /100 | #186 | Fair 1.8% |
| Czechoslovakians | 33.0 /100 | #187 | Fair 1.8% |
| Germans | 30.5 /100 | #188 | Fair 1.8% |
| French Canadians | 30.2 /100 | #189 | Fair 1.8% |
| Immigrants | Costa Rica | 30.2 /100 | #190 | Fair 1.8% |
| South Americans | 29.5 /100 | #191 | Fair 1.8% |
| Dutch | 27.4 /100 | #192 | Fair 1.8% |
| German Russians | 27.1 /100 | #193 | Fair 1.8% |
| Uruguayans | 26.2 /100 | #194 | Fair 1.8% |
Demographics Similar to Immigrants from Jamaica by Doctorate Degree
In terms of doctorate degree, the demographic groups most similar to Immigrants from Jamaica are Immigrants from Honduras (1.4%, a difference of 0.18%), Immigrants from Grenada (1.4%, a difference of 0.30%), Immigrants from Nicaragua (1.4%, a difference of 0.55%), Immigrants from Laos (1.4%, a difference of 0.71%), and Cuban (1.4%, a difference of 0.76%).
| Demographics | Rating | Rank | Doctorate Degree |
| Immigrants | Dominica | 0.1 /100 | #303 | Tragic 1.4% |
| Mexican American Indians | 0.1 /100 | #304 | Tragic 1.4% |
| Pennsylvania Germans | 0.1 /100 | #305 | Tragic 1.4% |
| Guyanese | 0.1 /100 | #306 | Tragic 1.4% |
| Cubans | 0.1 /100 | #307 | Tragic 1.4% |
| Immigrants | Laos | 0.1 /100 | #308 | Tragic 1.4% |
| Immigrants | Grenada | 0.1 /100 | #309 | Tragic 1.4% |
| Immigrants | Jamaica | 0.1 /100 | #310 | Tragic 1.4% |
| Immigrants | Honduras | 0.1 /100 | #311 | Tragic 1.4% |
| Immigrants | Nicaragua | 0.1 /100 | #312 | Tragic 1.4% |
| Menominee | 0.1 /100 | #313 | Tragic 1.4% |
| Dominicans | 0.1 /100 | #314 | Tragic 1.4% |
| Immigrants | Azores | 0.1 /100 | #315 | Tragic 1.4% |
| Navajo | 0.1 /100 | #316 | Tragic 1.4% |
| Immigrants | Micronesia | 0.1 /100 | #317 | Tragic 1.3% |