Czechoslovakian vs Immigrants from the Azores Master's Degree

COMPARE

Czechoslovakian
Race
Ancestry
AfghanAfricanAlaska NativeAlaskan AthabascanAlbanianAleutAlsatianAmericanApacheArabArapahoArgentineanArmenianAssyrian/Chaldean/SyriacAustralianAustrianBahamianBangladeshiBarbadianBasqueBelgianBelizeanBermudanBhutaneseBlackfeetBolivianBrazilianBritishBritish West IndianBulgarianBurmeseCajunCambodianCanadianCape VerdeanCarpatho RusynCelticCentral AmericanCentral American IndianCherokeeCheyenneChickasawChileanChineseChippewaChoctawColombianColvilleComancheCosta RicanCreeCreekCroatianCrowCubanCypriotCzechCzechoslovakianDanishDelawareDominicanDutchDutch West IndianEastern EuropeanEcuadorianEgyptianEnglishEstonianEthiopianEuropeanFijianFilipinoFinnishFrenchFrench American IndianFrench CanadianGermanGerman RussianGhanaianGreekGuamanian/ChamorroGuatemalanGuyaneseHaitianHmongHonduranHopiHoumaHungarianIcelanderIndian (Asian)IndonesianInupiatIranianIraqiIrishIroquoisIsraeliItalianJamaicanJapaneseJordanianKenyanKiowaKoreanLaotianLatvianLebaneseLiberianLithuanianLumbeeLuxembourgerMacedonianMalaysianMalteseMarshalleseMenomineeMexicanMexican American IndianMongolianMoroccanNative HawaiianNavajoNepaleseNew ZealanderNicaraguanNigerianNorthern EuropeanNorwegianOkinawanOsageOttawaPaiutePakistaniPalestinianPanamanianParaguayanPennsylvania GermanPeruvianPimaPolishPortuguesePotawatomiPuebloPuerto RicanPuget Sound SalishRomanianRussianSalvadoranSamoanScandinavianScotch-IrishScottishSeminoleSenegaleseSerbianShoshoneSierra LeoneanSiouxSlavicSlovakSloveneSomaliSouth AfricanSouth AmericanSouth American IndianSoviet UnionSpaniardSpanishSpanish AmericanSpanish American IndianSri LankanSubsaharan AfricanSudaneseSwedishSwissSyrianTaiwaneseThaiTlingit-HaidaTohono O'OdhamTonganTrinidadian and TobagonianTsimshianTurkishU.S. Virgin IslanderUgandanUkrainianUruguayanUteVenezuelanVietnameseWelshWest IndianYakamaYaquiYugoslavianYumanYup'ikZimbabwean
Immigration
NonimmigrantsImmigrantsAfghanistanAfricaAlbaniaArgentinaArmeniaAsiaAustraliaAustriaBahamasBangladeshBarbadosBelarusBelgiumBelizeBoliviaBosnia and HerzegovinaBrazilBulgariaBurma/MyanmarCabo VerdeCambodiaCameroonCanadaCaribbeanCentral AmericaChileChinaColombiaCongoCosta RicaCroatiaCubaCzechoslovakiaDenmarkDominicaDominican RepublicEastern AfricaEastern AsiaEastern EuropeEcuadorEgyptEl SalvadorEnglandEritreaEthiopiaEuropeFijiFranceGermanyGhanaGreeceGrenadaGuatemalaGuyanaHaitiHondurasHong KongHungaryIndiaIndonesiaIranIraqIrelandIsraelItalyJamaicaJapanJordanKazakhstanKenyaKoreaKuwaitLaosLatin AmericaLatviaLebanonLiberiaLithuaniaMalaysiaMexicoMicronesiaMiddle AfricaMoldovaMoroccoNepalNetherlandsNicaraguaNigeriaNorth AmericaNorth MacedoniaNorthern AfricaNorthern EuropeNorwayOceaniaPakistanPanamaPeruPhilippinesPolandPortugalRomaniaRussiaSaudi ArabiaScotlandSenegalSerbiaSierra LeoneSingaporeSomaliaSouth AfricaSouth AmericaSouth Central AsiaSouth Eastern AsiaSouthern EuropeSpainSri LankaSt. Vincent and the GrenadinesSudanSwedenSwitzerlandSyriaTaiwanThailandTrinidad and TobagoTurkeyUgandaUkraineUruguayUzbekistanVenezuelaVietnamWest IndiesWestern AfricaWestern AsiaWestern EuropeYemenZaireZimbabwe
Immigrants from the Azores
Race
Ancestry
AfghanAfricanAlaska NativeAlaskan AthabascanAlbanianAleutAlsatianAmericanApacheArabArapahoArgentineanArmenianAssyrian/Chaldean/SyriacAustralianAustrianBahamianBangladeshiBarbadianBasqueBelgianBelizeanBermudanBhutaneseBlackfeetBolivianBrazilianBritishBritish West IndianBulgarianBurmeseCajunCambodianCanadianCape VerdeanCarpatho RusynCelticCentral AmericanCentral American IndianCherokeeCheyenneChickasawChileanChineseChippewaChoctawColombianColvilleComancheCosta RicanCreeCreekCroatianCrowCubanCypriotCzechDanishDelawareDominicanDutchDutch West IndianEastern EuropeanEcuadorianEgyptianEnglishEstonianEthiopianEuropeanFijianFilipinoFinnishFrenchFrench American IndianFrench CanadianGermanGerman RussianGhanaianGreekGuamanian/ChamorroGuatemalanGuyaneseHaitianHmongHonduranHopiHoumaHungarianIcelanderIndian (Asian)IndonesianInupiatIranianIraqiIrishIroquoisIsraeliItalianJamaicanJapaneseJordanianKenyanKiowaKoreanLaotianLatvianLebaneseLiberianLithuanianLumbeeLuxembourgerMacedonianMalaysianMalteseMarshalleseMenomineeMexicanMexican American IndianMongolianMoroccanNative HawaiianNavajoNepaleseNew ZealanderNicaraguanNigerianNorthern EuropeanNorwegianOkinawanOsageOttawaPaiutePakistaniPalestinianPanamanianParaguayanPennsylvania GermanPeruvianPimaPolishPortuguesePotawatomiPuebloPuerto RicanPuget Sound SalishRomanianRussianSalvadoranSamoanScandinavianScotch-IrishScottishSeminoleSenegaleseSerbianShoshoneSierra LeoneanSiouxSlavicSlovakSloveneSomaliSouth AfricanSouth AmericanSouth American IndianSoviet UnionSpaniardSpanishSpanish AmericanSpanish American IndianSri LankanSubsaharan AfricanSudaneseSwedishSwissSyrianTaiwaneseThaiTlingit-HaidaTohono O'OdhamTonganTrinidadian and TobagonianTsimshianTurkishU.S. Virgin IslanderUgandanUkrainianUruguayanUteVenezuelanVietnameseWelshWest IndianYakamaYaquiYugoslavianYumanYup'ikZimbabwean
Immigration
NonimmigrantsImmigrantsAfghanistanAfricaAlbaniaArgentinaArmeniaAsiaAustraliaAustriaBahamasBangladeshBarbadosBelarusBelgiumBelizeBoliviaBosnia and HerzegovinaBrazilBulgariaBurma/MyanmarCabo VerdeCambodiaCameroonCanadaCaribbeanCentral AmericaChileChinaColombiaCongoCosta RicaCroatiaCubaCzechoslovakiaDenmarkDominicaDominican RepublicEastern AfricaEastern AsiaEastern EuropeEcuadorEgyptEl SalvadorEnglandEritreaEthiopiaEuropeFijiFranceGermanyGhanaGreeceGrenadaGuatemalaGuyanaHaitiHondurasHong KongHungaryIndiaIndonesiaIranIraqIrelandIsraelItalyJamaicaJapanJordanKazakhstanKenyaKoreaKuwaitLaosLatin AmericaLatviaLebanonLiberiaLithuaniaMalaysiaMexicoMicronesiaMiddle AfricaMoldovaMoroccoNepalNetherlandsNicaraguaNigeriaNorth AmericaNorth MacedoniaNorthern AfricaNorthern EuropeNorwayOceaniaPakistanPanamaPeruPhilippinesPolandPortugalRomaniaRussiaSaudi ArabiaScotlandSenegalSerbiaSierra LeoneSingaporeSomaliaSouth AfricaSouth AmericaSouth Central AsiaSouth Eastern AsiaSouthern EuropeSpainSri LankaSt. Vincent and the GrenadinesSudanSwedenSwitzerlandSyriaTaiwanThailandTrinidad and TobagoTurkeyUgandaUkraineUruguayUzbekistanVenezuelaVietnamWest IndiesWestern AfricaWestern AsiaWestern EuropeYemenZaireZimbabweAzores
Master's Degree
Income
Poverty
Unemployment
Labor Participation
Family Structure
Vehicle Availability
Education Level
Disability

Master's Degree Comparison

Czechoslovakians

Immigrants from the Azores

Fair
Tragic
14.5%
MASTER'S DEGREE
29.9/ 100
METRIC RATING
196th/ 347
METRIC RANK
10.2%
MASTER'S DEGREE
0.0/ 100
METRIC RATING
332nd/ 347
METRIC RANK

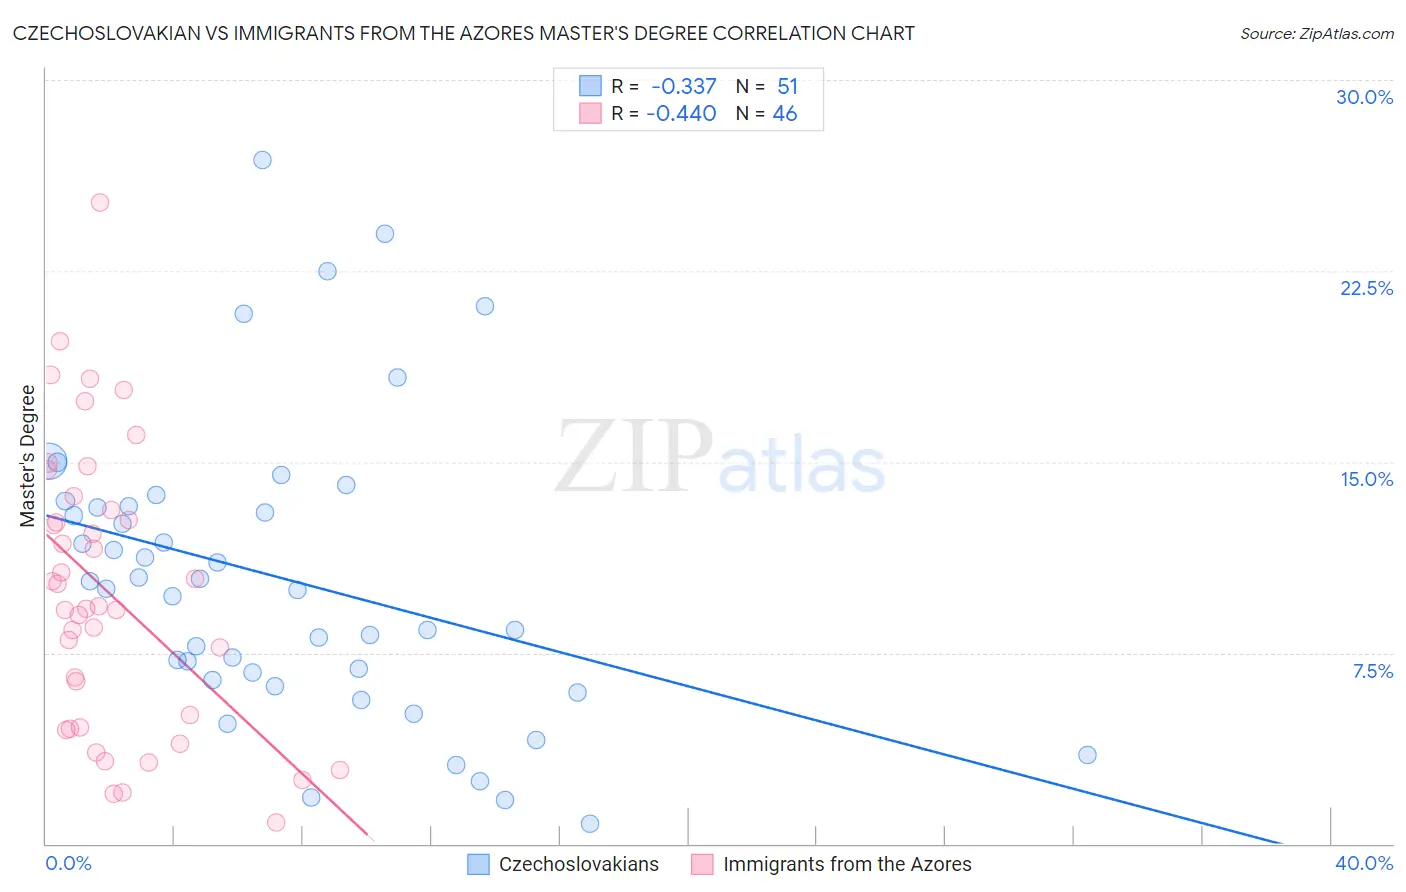
Czechoslovakian vs Immigrants from the Azores Master's Degree Correlation Chart

The statistical analysis conducted on geographies consisting of 368,562,573 people shows a mild negative correlation between the proportion of Czechoslovakians and percentage of population with at least master's degree education in the United States with a correlation coefficient (R) of -0.337 and weighted average of 14.5%. Similarly, the statistical analysis conducted on geographies consisting of 46,256,023 people shows a moderate negative correlation between the proportion of Immigrants from the Azores and percentage of population with at least master's degree education in the United States with a correlation coefficient (R) of -0.440 and weighted average of 10.2%, a difference of 41.9%.
Czechoslovakian vs Immigrants from the Azores Master's Degree

Master's Degree Correlation Summary

MeasurementCzechoslovakianImmigrants from the Azores
Minimum0.78%0.81%
Maximum26.9%25.2%
Range26.1%24.4%
Mean10.4%9.9%
Median10.0%9.3%
Interquartile 25% (IQ1)6.4%4.6%
Interquartile 75% (IQ3)13.3%13.1%
Interquartile Range (IQR)6.8%8.5%
Standard Deviation (Sample)5.8%5.6%
Standard Deviation (Population)5.7%5.5%

Similar Demographics by Master's Degree

Demographics Similar to Czechoslovakians by Master's Degree

In terms of master's degree, the demographic groups most similar to Czechoslovakians are Danish (14.5%, a difference of 0.22%), Belgian (14.5%, a difference of 0.31%), Chinese (14.6%, a difference of 0.39%), West Indian (14.5%, a difference of 0.41%), and Immigrants from Nigeria (14.6%, a difference of 0.43%).
DemographicsRating | RankMaster's Degree
Immigrants | Immigrants
36.0
/100
|
#189
Fair
14.6%
Spaniards
35.8
/100
|
#190
Fair
14.6%
Welsh
34.2
/100
|
#191
Fair
14.6%
Immigrants | Middle Africa
33.6
/100
|
#192
Fair
14.6%
Immigrants | Nigeria
32.7
/100
|
#193
Fair
14.6%
Chinese
32.5
/100
|
#194
Fair
14.6%
Danes
31.3
/100
|
#195
Fair
14.5%
Czechoslovakians
29.9
/100
|
#196
Fair
14.5%
Belgians
28.0
/100
|
#197
Fair
14.5%
West Indians
27.4
/100
|
#198
Fair
14.5%
Immigrants | Armenia
27.2
/100
|
#199
Fair
14.5%
Panamanians
25.1
/100
|
#200
Fair
14.4%
Scotch-Irish
25.0
/100
|
#201
Fair
14.4%
Immigrants | Western Africa
24.9
/100
|
#202
Fair
14.4%
Yugoslavians
24.3
/100
|
#203
Fair
14.4%

Demographics Similar to Immigrants from the Azores by Master's Degree

In terms of master's degree, the demographic groups most similar to Immigrants from the Azores are Menominee (10.2%, a difference of 0.37%), Pueblo (10.3%, a difference of 0.46%), Fijian (10.3%, a difference of 0.63%), Arapaho (10.0%, a difference of 2.3%), and Nepalese (10.5%, a difference of 2.4%).
DemographicsRating | RankMaster's Degree
Inupiat
0.0
/100
|
#325
Tragic
10.5%
Creek
0.0
/100
|
#326
Tragic
10.5%
Paiute
0.0
/100
|
#327
Tragic
10.5%
Bangladeshis
0.0
/100
|
#328
Tragic
10.5%
Nepalese
0.0
/100
|
#329
Tragic
10.5%
Fijians
0.0
/100
|
#330
Tragic
10.3%
Pueblo
0.0
/100
|
#331
Tragic
10.3%
Immigrants | Azores
0.0
/100
|
#332
Tragic
10.2%
Menominee
0.0
/100
|
#333
Tragic
10.2%
Arapaho
0.0
/100
|
#334
Tragic
10.0%
Immigrants | Central America
0.0
/100
|
#335
Tragic
10.0%
Natives/Alaskans
0.0
/100
|
#336
Tragic
9.9%
Mexicans
0.0
/100
|
#337
Tragic
9.7%
Tohono O'odham
0.0
/100
|
#338
Tragic
9.7%
Spanish American Indians
0.0
/100
|
#339
Tragic
9.6%