Cypriot vs Immigrants from Jamaica 10th Grade
COMPARE
Cypriot
Immigrants from Jamaica
10th Grade
10th Grade Comparison
Cypriots
Immigrants from Jamaica
95.0%
10TH GRADE
99.8/ 100
METRIC RATING
60th/ 347
METRIC RANK
92.6%
10TH GRADE
0.5/ 100
METRIC RATING
259th/ 347
METRIC RANK
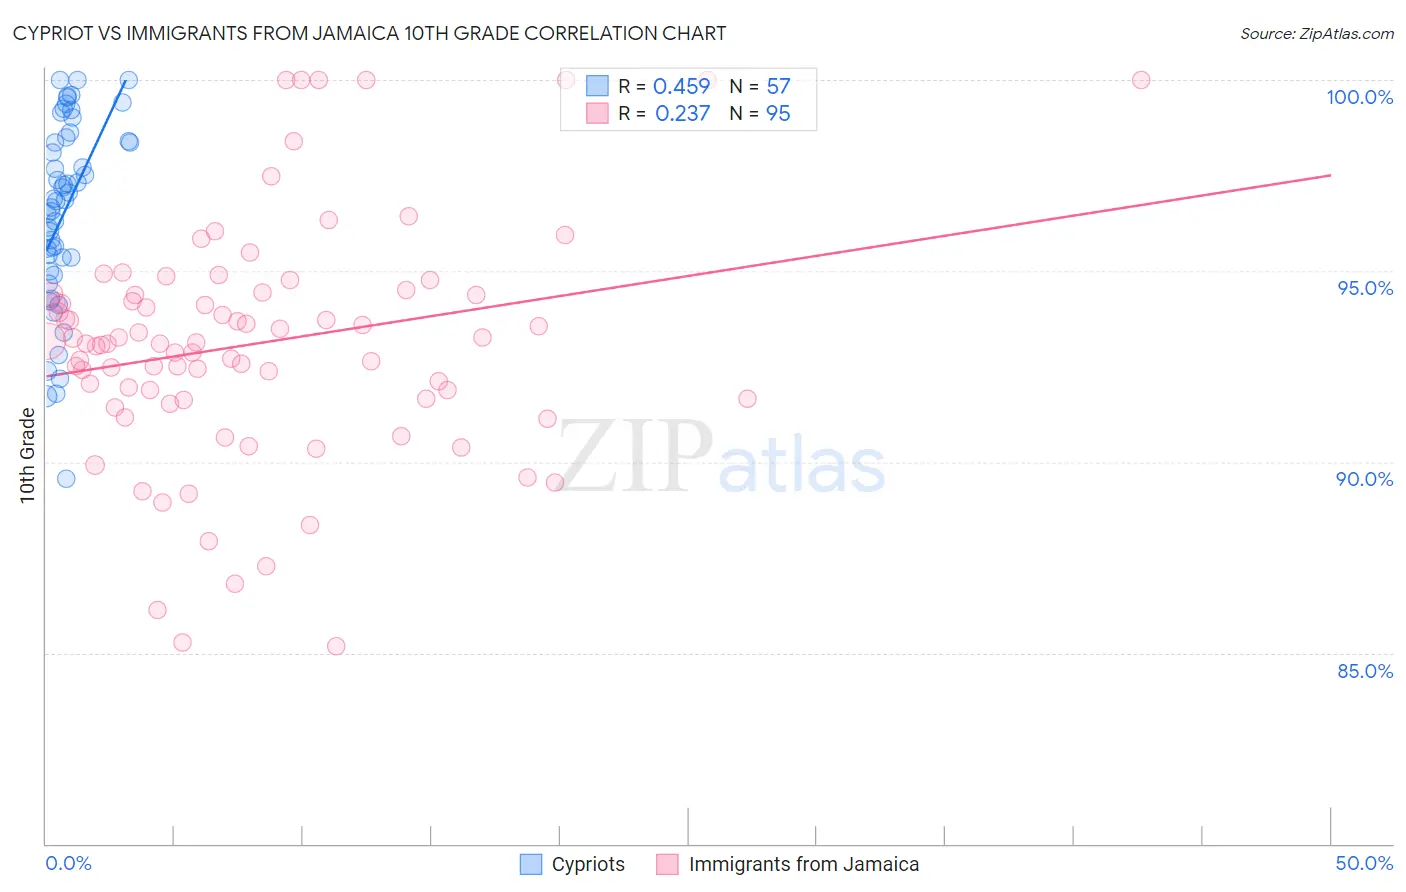
Cypriot vs Immigrants from Jamaica 10th Grade Correlation Chart
The statistical analysis conducted on geographies consisting of 61,870,289 people shows a moderate positive correlation between the proportion of Cypriots and percentage of population with at least 10th grade education in the United States with a correlation coefficient (R) of 0.459 and weighted average of 95.0%. Similarly, the statistical analysis conducted on geographies consisting of 301,829,550 people shows a weak positive correlation between the proportion of Immigrants from Jamaica and percentage of population with at least 10th grade education in the United States with a correlation coefficient (R) of 0.237 and weighted average of 92.6%, a difference of 2.5%.
10th Grade Correlation Summary
| Measurement | Cypriot | Immigrants from Jamaica |
| Minimum | 89.5% | 85.2% |
| Maximum | 100.0% | 100.0% |
| Range | 10.5% | 14.8% |
| Mean | 96.5% | 93.1% |
| Median | 96.8% | 93.1% |
| Interquartile 25% (IQ1) | 95.2% | 91.6% |
| Interquartile 75% (IQ3) | 98.4% | 94.4% |
| Interquartile Range (IQR) | 3.3% | 2.8% |
| Standard Deviation (Sample) | 2.4% | 3.1% |
| Standard Deviation (Population) | 2.4% | 3.1% |
Similar Demographics by 10th Grade
Demographics Similar to Cypriots by 10th Grade
In terms of 10th grade, the demographic groups most similar to Cypriots are Chippewa (95.0%, a difference of 0.0%), Aleut (95.0%, a difference of 0.010%), Celtic (95.0%, a difference of 0.010%), Thai (95.0%, a difference of 0.010%), and Immigrants from Singapore (95.0%, a difference of 0.010%).
| Demographics | Rating | Rank | 10th Grade |
| Immigrants | North America | 99.8 /100 | #53 | Exceptional 95.0% |
| Immigrants | Lithuania | 99.8 /100 | #54 | Exceptional 95.0% |
| Immigrants | Ireland | 99.8 /100 | #55 | Exceptional 95.0% |
| New Zealanders | 99.8 /100 | #56 | Exceptional 95.0% |
| Ukrainians | 99.8 /100 | #57 | Exceptional 95.0% |
| Aleuts | 99.8 /100 | #58 | Exceptional 95.0% |
| Celtics | 99.8 /100 | #59 | Exceptional 95.0% |
| Cypriots | 99.8 /100 | #60 | Exceptional 95.0% |
| Chippewa | 99.8 /100 | #61 | Exceptional 95.0% |
| Thais | 99.8 /100 | #62 | Exceptional 95.0% |
| Immigrants | Singapore | 99.8 /100 | #63 | Exceptional 95.0% |
| Native Hawaiians | 99.7 /100 | #64 | Exceptional 95.0% |
| Turks | 99.7 /100 | #65 | Exceptional 95.0% |
| Immigrants | Australia | 99.7 /100 | #66 | Exceptional 94.9% |
| Immigrants | Netherlands | 99.7 /100 | #67 | Exceptional 94.9% |
Demographics Similar to Immigrants from Jamaica by 10th Grade
In terms of 10th grade, the demographic groups most similar to Immigrants from Jamaica are Immigrants from Uzbekistan (92.6%, a difference of 0.010%), U.S. Virgin Islander (92.7%, a difference of 0.040%), Immigrants from Costa Rica (92.7%, a difference of 0.040%), Paiute (92.6%, a difference of 0.050%), and Immigrants from Bolivia (92.7%, a difference of 0.060%).
| Demographics | Rating | Rank | 10th Grade |
| South Americans | 0.9 /100 | #252 | Tragic 92.8% |
| Ghanaians | 0.9 /100 | #253 | Tragic 92.8% |
| Armenians | 0.9 /100 | #254 | Tragic 92.7% |
| Immigrants | Bolivia | 0.7 /100 | #255 | Tragic 92.7% |
| Immigrants | Nigeria | 0.7 /100 | #256 | Tragic 92.7% |
| U.S. Virgin Islanders | 0.7 /100 | #257 | Tragic 92.7% |
| Immigrants | Costa Rica | 0.6 /100 | #258 | Tragic 92.7% |
| Immigrants | Jamaica | 0.5 /100 | #259 | Tragic 92.6% |
| Immigrants | Uzbekistan | 0.5 /100 | #260 | Tragic 92.6% |
| Paiute | 0.4 /100 | #261 | Tragic 92.6% |
| Immigrants | South America | 0.4 /100 | #262 | Tragic 92.6% |
| Apache | 0.4 /100 | #263 | Tragic 92.6% |
| Peruvians | 0.4 /100 | #264 | Tragic 92.6% |
| Dutch West Indians | 0.4 /100 | #265 | Tragic 92.6% |
| Immigrants | Philippines | 0.4 /100 | #266 | Tragic 92.6% |