Basque vs Immigrants from Jamaica 10th Grade

COMPARE

Basque
Race
Ancestry
AfghanAfricanAlaska NativeAlaskan AthabascanAlbanianAleutAlsatianAmericanApacheArabArapahoArgentineanArmenianAssyrian/Chaldean/SyriacAustralianAustrianBahamianBangladeshiBarbadianBasqueBelgianBelizeanBermudanBhutaneseBlackfeetBolivianBrazilianBritishBritish West IndianBulgarianBurmeseCajunCambodianCanadianCape VerdeanCarpatho RusynCelticCentral AmericanCentral American IndianCherokeeCheyenneChickasawChileanChineseChippewaChoctawColombianColvilleComancheCosta RicanCreeCreekCroatianCrowCubanCypriotCzechCzechoslovakianDanishDelawareDominicanDutchDutch West IndianEastern EuropeanEcuadorianEgyptianEnglishEstonianEthiopianEuropeanFijianFilipinoFinnishFrenchFrench American IndianFrench CanadianGermanGerman RussianGhanaianGreekGuamanian/ChamorroGuatemalanGuyaneseHaitianHmongHonduranHopiHoumaHungarianIcelanderIndian (Asian)IndonesianInupiatIranianIraqiIrishIroquoisIsraeliItalianJamaicanJapaneseJordanianKenyanKiowaKoreanLaotianLatvianLebaneseLiberianLithuanianLumbeeLuxembourgerMacedonianMalaysianMalteseMarshalleseMenomineeMexicanMexican American IndianMongolianMoroccanNative HawaiianNavajoNepaleseNew ZealanderNicaraguanNigerianNorthern EuropeanNorwegianOkinawanOsageOttawaPaiutePakistaniPalestinianPanamanianParaguayanPennsylvania GermanPeruvianPimaPolishPortuguesePotawatomiPuebloPuerto RicanPuget Sound SalishRomanianRussianSalvadoranSamoanScandinavianScotch-IrishScottishSeminoleSenegaleseSerbianShoshoneSierra LeoneanSiouxSlavicSlovakSloveneSomaliSouth AfricanSouth AmericanSouth American IndianSoviet UnionSpaniardSpanishSpanish AmericanSpanish American IndianSri LankanSubsaharan AfricanSudaneseSwedishSwissSyrianTaiwaneseThaiTlingit-HaidaTohono O'OdhamTonganTrinidadian and TobagonianTsimshianTurkishU.S. Virgin IslanderUgandanUkrainianUruguayanUteVenezuelanVietnameseWelshWest IndianYakamaYaquiYugoslavianYumanYup'ikZimbabwean
Immigration
NonimmigrantsImmigrantsAfghanistanAfricaAlbaniaArgentinaArmeniaAsiaAustraliaAustriaBahamasBangladeshBarbadosBelarusBelgiumBelizeBoliviaBosnia and HerzegovinaBrazilBulgariaBurma/MyanmarCabo VerdeCambodiaCameroonCanadaCaribbeanCentral AmericaChileChinaColombiaCongoCosta RicaCroatiaCubaCzechoslovakiaDenmarkDominicaDominican RepublicEastern AfricaEastern AsiaEastern EuropeEcuadorEgyptEl SalvadorEnglandEritreaEthiopiaEuropeFijiFranceGermanyGhanaGreeceGrenadaGuatemalaGuyanaHaitiHondurasHong KongHungaryIndiaIndonesiaIranIraqIrelandIsraelItalyJapanJordanKazakhstanKenyaKoreaKuwaitLaosLatin AmericaLatviaLebanonLiberiaLithuaniaMalaysiaMexicoMicronesiaMiddle AfricaMoldovaMoroccoNepalNetherlandsNicaraguaNigeriaNorth AmericaNorth MacedoniaNorthern AfricaNorthern EuropeNorwayOceaniaPakistanPanamaPeruPhilippinesPolandPortugalRomaniaRussiaSaudi ArabiaScotlandSenegalSerbiaSierra LeoneSingaporeSomaliaSouth AfricaSouth AmericaSouth Central AsiaSouth Eastern AsiaSouthern EuropeSpainSri LankaSt. Vincent and the GrenadinesSudanSwedenSwitzerlandSyriaTaiwanThailandTrinidad and TobagoTurkeyUgandaUkraineUruguayUzbekistanVenezuelaVietnamWest IndiesWestern AfricaWestern AsiaWestern EuropeYemenZaireZimbabweAzores
Immigrants from Jamaica
Race
Ancestry
AfghanAfricanAlaska NativeAlaskan AthabascanAlbanianAleutAlsatianAmericanApacheArabArapahoArgentineanArmenianAssyrian/Chaldean/SyriacAustralianAustrianBahamianBangladeshiBarbadianBelgianBelizeanBermudanBhutaneseBlackfeetBolivianBrazilianBritishBritish West IndianBulgarianBurmeseCajunCambodianCanadianCape VerdeanCarpatho RusynCelticCentral AmericanCentral American IndianCherokeeCheyenneChickasawChileanChineseChippewaChoctawColombianColvilleComancheCosta RicanCreeCreekCroatianCrowCubanCypriotCzechCzechoslovakianDanishDelawareDominicanDutchDutch West IndianEastern EuropeanEcuadorianEgyptianEnglishEstonianEthiopianEuropeanFijianFilipinoFinnishFrenchFrench American IndianFrench CanadianGermanGerman RussianGhanaianGreekGuamanian/ChamorroGuatemalanGuyaneseHaitianHmongHonduranHopiHoumaHungarianIcelanderIndian (Asian)IndonesianInupiatIranianIraqiIrishIroquoisIsraeliItalianJamaicanJapaneseJordanianKenyanKiowaKoreanLaotianLatvianLebaneseLiberianLithuanianLumbeeLuxembourgerMacedonianMalaysianMalteseMarshalleseMenomineeMexicanMexican American IndianMongolianMoroccanNative HawaiianNavajoNepaleseNew ZealanderNicaraguanNigerianNorthern EuropeanNorwegianOkinawanOsageOttawaPaiutePakistaniPalestinianPanamanianParaguayanPennsylvania GermanPeruvianPimaPolishPortuguesePotawatomiPuebloPuerto RicanPuget Sound SalishRomanianRussianSalvadoranSamoanScandinavianScotch-IrishScottishSeminoleSenegaleseSerbianShoshoneSierra LeoneanSiouxSlavicSlovakSloveneSomaliSouth AfricanSouth AmericanSouth American IndianSoviet UnionSpaniardSpanishSpanish AmericanSpanish American IndianSri LankanSubsaharan AfricanSudaneseSwedishSwissSyrianTaiwaneseThaiTlingit-HaidaTohono O'OdhamTonganTrinidadian and TobagonianTsimshianTurkishU.S. Virgin IslanderUgandanUkrainianUruguayanUteVenezuelanVietnameseWelshWest IndianYakamaYaquiYugoslavianYumanYup'ikZimbabwean
Immigration
NonimmigrantsImmigrantsAfghanistanAfricaAlbaniaArgentinaArmeniaAsiaAustraliaAustriaBahamasBangladeshBarbadosBelarusBelgiumBelizeBoliviaBosnia and HerzegovinaBrazilBulgariaBurma/MyanmarCabo VerdeCambodiaCameroonCanadaCaribbeanCentral AmericaChileChinaColombiaCongoCosta RicaCroatiaCubaCzechoslovakiaDenmarkDominicaDominican RepublicEastern AfricaEastern AsiaEastern EuropeEcuadorEgyptEl SalvadorEnglandEritreaEthiopiaEuropeFijiFranceGermanyGhanaGreeceGrenadaGuatemalaGuyanaHaitiHondurasHong KongHungaryIndiaIndonesiaIranIraqIrelandIsraelItalyJamaicaJapanJordanKazakhstanKenyaKoreaKuwaitLaosLatin AmericaLatviaLebanonLiberiaLithuaniaMalaysiaMexicoMicronesiaMiddle AfricaMoldovaMoroccoNepalNetherlandsNicaraguaNigeriaNorth AmericaNorth MacedoniaNorthern AfricaNorthern EuropeNorwayOceaniaPakistanPanamaPeruPhilippinesPolandPortugalRomaniaRussiaSaudi ArabiaScotlandSenegalSerbiaSierra LeoneSingaporeSomaliaSouth AfricaSouth AmericaSouth Central AsiaSouth Eastern AsiaSouthern EuropeSpainSri LankaSt. Vincent and the GrenadinesSudanSwedenSwitzerlandSyriaTaiwanThailandTrinidad and TobagoTurkeyUgandaUkraineUruguayUzbekistanVenezuelaVietnamWest IndiesWestern AfricaWestern AsiaWestern EuropeYemenZaireZimbabweAzores
10th Grade
Income
Poverty
Unemployment
Labor Participation
Family Structure
Vehicle Availability
Education Level
Disability

10th Grade Comparison

Basques

Immigrants from Jamaica

Exceptional
Tragic
94.3%
10TH GRADE
94.9/ 100
METRIC RATING
124th/ 347
METRIC RANK
92.6%
10TH GRADE
0.5/ 100
METRIC RATING
259th/ 347
METRIC RANK

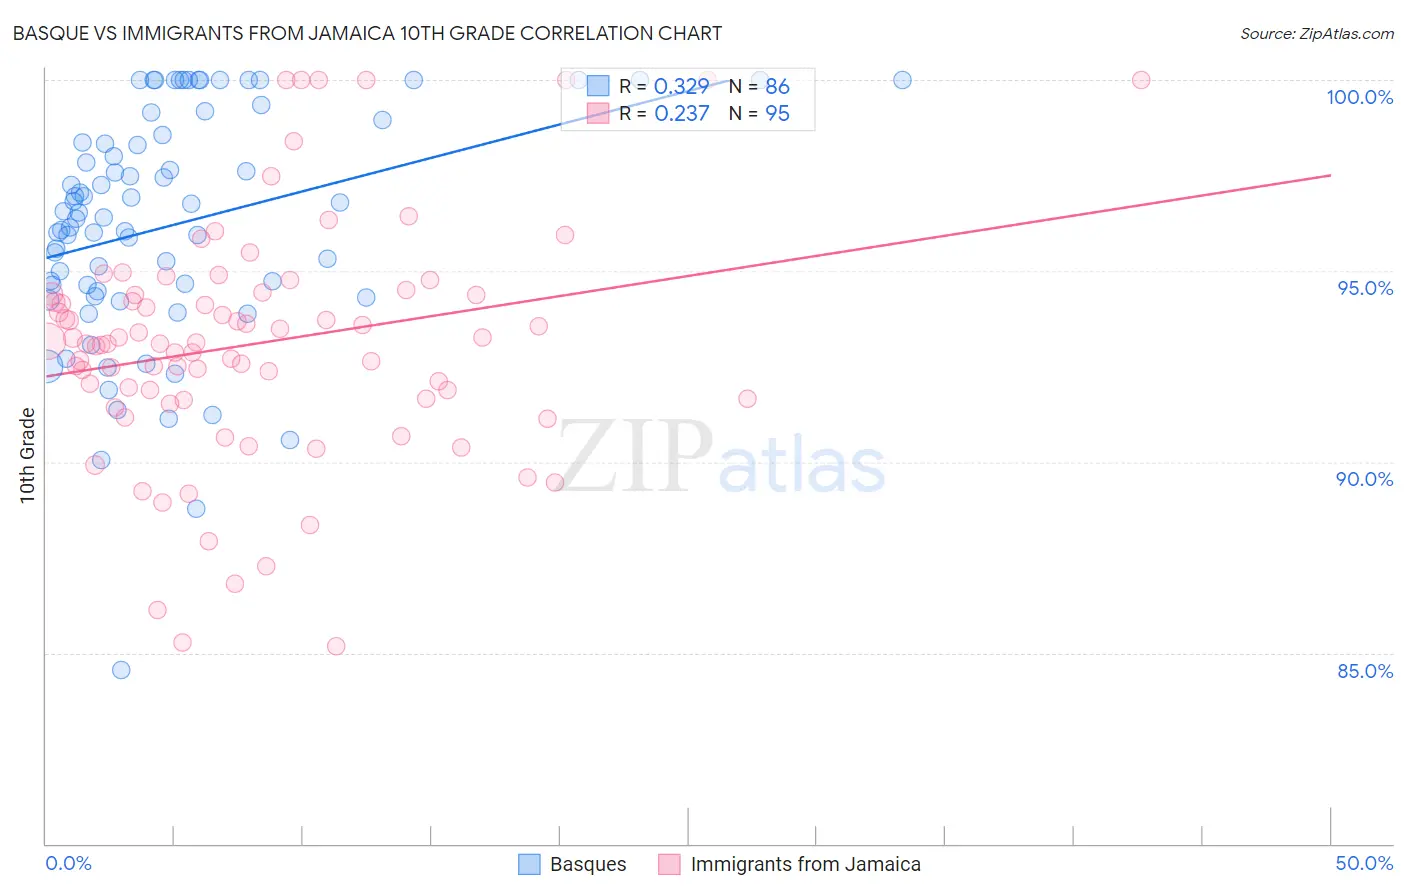
Basque vs Immigrants from Jamaica 10th Grade Correlation Chart

The statistical analysis conducted on geographies consisting of 165,776,783 people shows a mild positive correlation between the proportion of Basques and percentage of population with at least 10th grade education in the United States with a correlation coefficient (R) of 0.329 and weighted average of 94.3%. Similarly, the statistical analysis conducted on geographies consisting of 301,829,550 people shows a weak positive correlation between the proportion of Immigrants from Jamaica and percentage of population with at least 10th grade education in the United States with a correlation coefficient (R) of 0.237 and weighted average of 92.6%, a difference of 1.8%.
Basque vs Immigrants from Jamaica 10th Grade

10th Grade Correlation Summary

MeasurementBasqueImmigrants from Jamaica
Minimum84.6%85.2%
Maximum100.0%100.0%
Range15.4%14.8%
Mean96.2%93.1%
Median96.5%93.1%
Interquartile 25% (IQ1)94.5%91.6%
Interquartile 75% (IQ3)98.6%94.4%
Interquartile Range (IQR)4.1%2.8%
Standard Deviation (Sample)3.1%3.1%
Standard Deviation (Population)3.1%3.1%

Similar Demographics by 10th Grade

Demographics Similar to Basques by 10th Grade

In terms of 10th grade, the demographic groups most similar to Basques are Immigrants from Belarus (94.4%, a difference of 0.010%), Inupiat (94.4%, a difference of 0.010%), Cree (94.4%, a difference of 0.010%), Immigrants from Taiwan (94.4%, a difference of 0.020%), and American (94.3%, a difference of 0.020%).
DemographicsRating | Rank10th Grade
Immigrants | Hungary
95.8
/100
|
#117
Exceptional
94.4%
Jordanians
95.6
/100
|
#118
Exceptional
94.4%
Immigrants | Israel
95.4
/100
|
#119
Exceptional
94.4%
Immigrants | Taiwan
95.3
/100
|
#120
Exceptional
94.4%
Immigrants | Belarus
95.2
/100
|
#121
Exceptional
94.4%
Inupiat
95.1
/100
|
#122
Exceptional
94.4%
Cree
95.1
/100
|
#123
Exceptional
94.4%
Basques
94.9
/100
|
#124
Exceptional
94.3%
Americans
94.4
/100
|
#125
Exceptional
94.3%
Immigrants | Iran
94.4
/100
|
#126
Exceptional
94.3%
Israelis
93.8
/100
|
#127
Exceptional
94.3%
Potawatomi
93.6
/100
|
#128
Exceptional
94.3%
Iroquois
92.8
/100
|
#129
Exceptional
94.3%
Immigrants | Greece
92.7
/100
|
#130
Exceptional
94.3%
Immigrants | Eastern Europe
92.5
/100
|
#131
Exceptional
94.3%

Demographics Similar to Immigrants from Jamaica by 10th Grade

In terms of 10th grade, the demographic groups most similar to Immigrants from Jamaica are Immigrants from Uzbekistan (92.6%, a difference of 0.010%), U.S. Virgin Islander (92.7%, a difference of 0.040%), Immigrants from Costa Rica (92.7%, a difference of 0.040%), Paiute (92.6%, a difference of 0.050%), and Immigrants from Bolivia (92.7%, a difference of 0.060%).
DemographicsRating | Rank10th Grade
South Americans
0.9
/100
|
#252
Tragic
92.8%
Ghanaians
0.9
/100
|
#253
Tragic
92.8%
Armenians
0.9
/100
|
#254
Tragic
92.7%
Immigrants | Bolivia
0.7
/100
|
#255
Tragic
92.7%
Immigrants | Nigeria
0.7
/100
|
#256
Tragic
92.7%
U.S. Virgin Islanders
0.7
/100
|
#257
Tragic
92.7%
Immigrants | Costa Rica
0.6
/100
|
#258
Tragic
92.7%
Immigrants | Jamaica
0.5
/100
|
#259
Tragic
92.6%
Immigrants | Uzbekistan
0.5
/100
|
#260
Tragic
92.6%
Paiute
0.4
/100
|
#261
Tragic
92.6%
Immigrants | South America
0.4
/100
|
#262
Tragic
92.6%
Apache
0.4
/100
|
#263
Tragic
92.6%
Peruvians
0.4
/100
|
#264
Tragic
92.6%
Dutch West Indians
0.4
/100
|
#265
Tragic
92.6%
Immigrants | Philippines
0.4
/100
|
#266
Tragic
92.6%