Creek vs Choctaw 3rd Grade
COMPARE
Creek
Choctaw
3rd Grade
3rd Grade Comparison
Creek
Choctaw
98.2%
3RD GRADE
99.7/ 100
METRIC RATING
60th/ 347
METRIC RANK
98.1%
3RD GRADE
98.0/ 100
METRIC RATING
98th/ 347
METRIC RANK
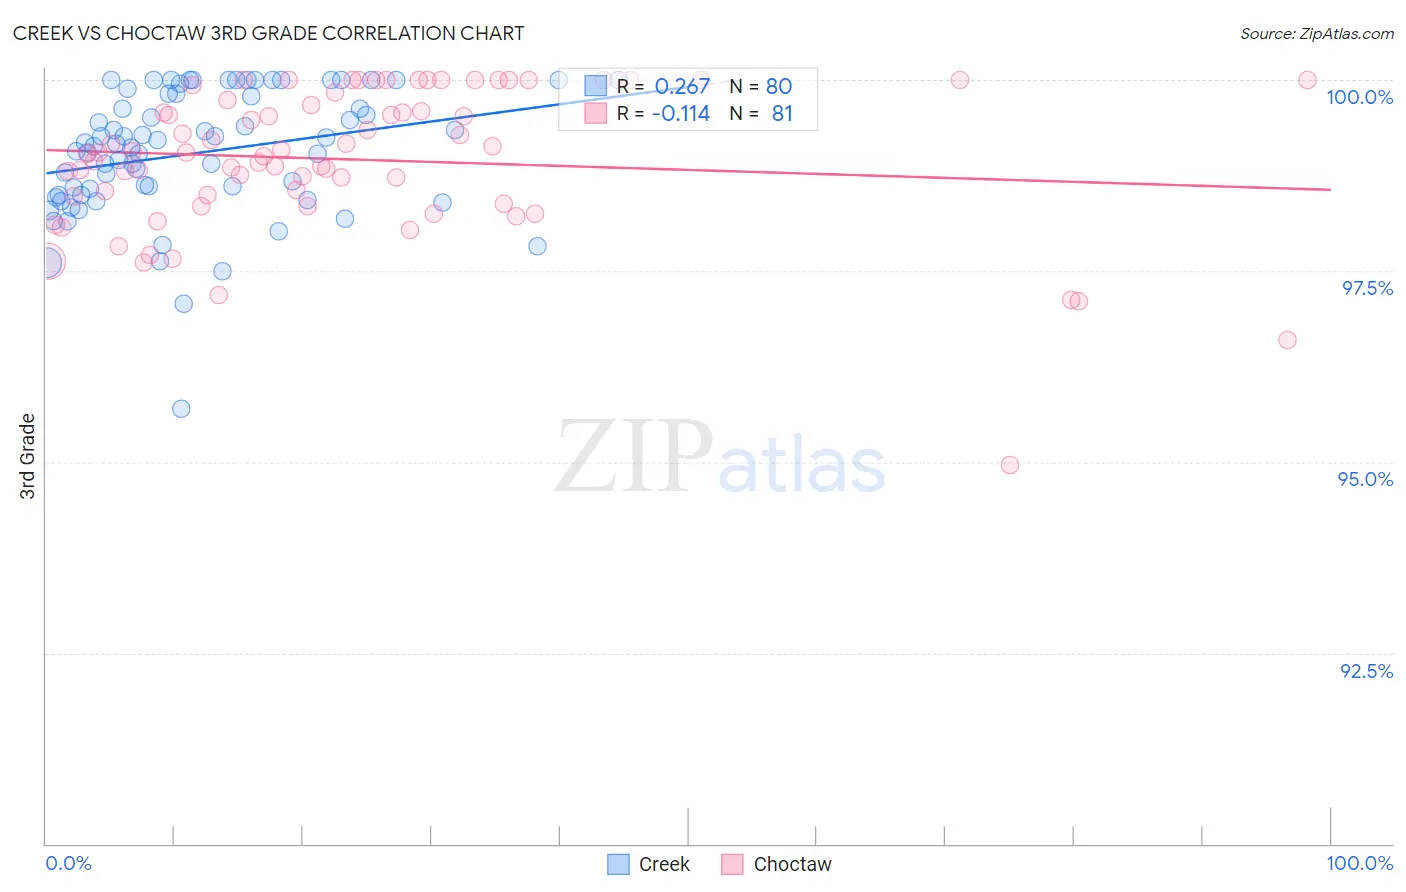
Creek vs Choctaw 3rd Grade Correlation Chart
The statistical analysis conducted on geographies consisting of 178,480,663 people shows a weak positive correlation between the proportion of Creek and percentage of population with at least 3rd grade education in the United States with a correlation coefficient (R) of 0.267 and weighted average of 98.2%. Similarly, the statistical analysis conducted on geographies consisting of 269,742,875 people shows a poor negative correlation between the proportion of Choctaw and percentage of population with at least 3rd grade education in the United States with a correlation coefficient (R) of -0.114 and weighted average of 98.1%, a difference of 0.17%.
3rd Grade Correlation Summary
| Measurement | Creek | Choctaw |
| Minimum | 95.7% | 95.0% |
| Maximum | 100.0% | 100.0% |
| Range | 4.3% | 5.0% |
| Mean | 99.0% | 99.0% |
| Median | 99.1% | 99.1% |
| Interquartile 25% (IQ1) | 98.5% | 98.4% |
| Interquartile 75% (IQ3) | 99.8% | 99.8% |
| Interquartile Range (IQR) | 1.3% | 1.4% |
| Standard Deviation (Sample) | 0.83% | 0.95% |
| Standard Deviation (Population) | 0.82% | 0.94% |
Similar Demographics by 3rd Grade
Demographics Similar to Creek by 3rd Grade
In terms of 3rd grade, the demographic groups most similar to Creek are Slavic (98.3%, a difference of 0.0%), Greek (98.3%, a difference of 0.0%), Maltese (98.3%, a difference of 0.0%), Bulgarian (98.3%, a difference of 0.010%), and American (98.3%, a difference of 0.010%).
| Demographics | Rating | Rank | 3rd Grade |
| Immigrants | Scotland | 99.8 /100 | #53 | Exceptional 98.3% |
| Bulgarians | 99.8 /100 | #54 | Exceptional 98.3% |
| Americans | 99.8 /100 | #55 | Exceptional 98.3% |
| Austrians | 99.8 /100 | #56 | Exceptional 98.3% |
| Slavs | 99.7 /100 | #57 | Exceptional 98.3% |
| Greeks | 99.7 /100 | #58 | Exceptional 98.3% |
| Maltese | 99.7 /100 | #59 | Exceptional 98.3% |
| Creek | 99.7 /100 | #60 | Exceptional 98.2% |
| Pueblo | 99.7 /100 | #61 | Exceptional 98.2% |
| Immigrants | Canada | 99.7 /100 | #62 | Exceptional 98.2% |
| Immigrants | North America | 99.7 /100 | #63 | Exceptional 98.2% |
| Kiowa | 99.6 /100 | #64 | Exceptional 98.2% |
| New Zealanders | 99.6 /100 | #65 | Exceptional 98.2% |
| Serbians | 99.6 /100 | #66 | Exceptional 98.2% |
| Russians | 99.6 /100 | #67 | Exceptional 98.2% |
Demographics Similar to Choctaw by 3rd Grade
In terms of 3rd grade, the demographic groups most similar to Choctaw are Romanian (98.1%, a difference of 0.0%), Cree (98.1%, a difference of 0.0%), Immigrants from Ireland (98.1%, a difference of 0.010%), South African (98.1%, a difference of 0.010%), and Puget Sound Salish (98.1%, a difference of 0.010%).
| Demographics | Rating | Rank | 3rd Grade |
| Hopi | 98.7 /100 | #91 | Exceptional 98.1% |
| Immigrants | South Africa | 98.7 /100 | #92 | Exceptional 98.1% |
| Immigrants | Western Europe | 98.7 /100 | #93 | Exceptional 98.1% |
| Immigrants | Germany | 98.4 /100 | #94 | Exceptional 98.1% |
| Cypriots | 98.4 /100 | #95 | Exceptional 98.1% |
| Immigrants | Ireland | 98.2 /100 | #96 | Exceptional 98.1% |
| South Africans | 98.2 /100 | #97 | Exceptional 98.1% |
| Choctaw | 98.0 /100 | #98 | Exceptional 98.1% |
| Romanians | 98.0 /100 | #99 | Exceptional 98.1% |
| Cree | 97.9 /100 | #100 | Exceptional 98.1% |
| Puget Sound Salish | 97.9 /100 | #101 | Exceptional 98.1% |
| Immigrants | Nonimmigrants | 97.8 /100 | #102 | Exceptional 98.1% |
| Yugoslavians | 97.7 /100 | #103 | Exceptional 98.1% |
| Turks | 97.6 /100 | #104 | Exceptional 98.1% |
| German Russians | 97.2 /100 | #105 | Exceptional 98.1% |