Cree vs Paraguayan No Schooling Completed
COMPARE
Cree
Paraguayan
No Schooling Completed
No Schooling Completed Comparison
Cree
Paraguayans
1.9%
NO SCHOOLING COMPLETED
94.5/ 100
METRIC RATING
122nd/ 347
METRIC RANK
2.2%
NO SCHOOLING COMPLETED
29.3/ 100
METRIC RATING
193rd/ 347
METRIC RANK
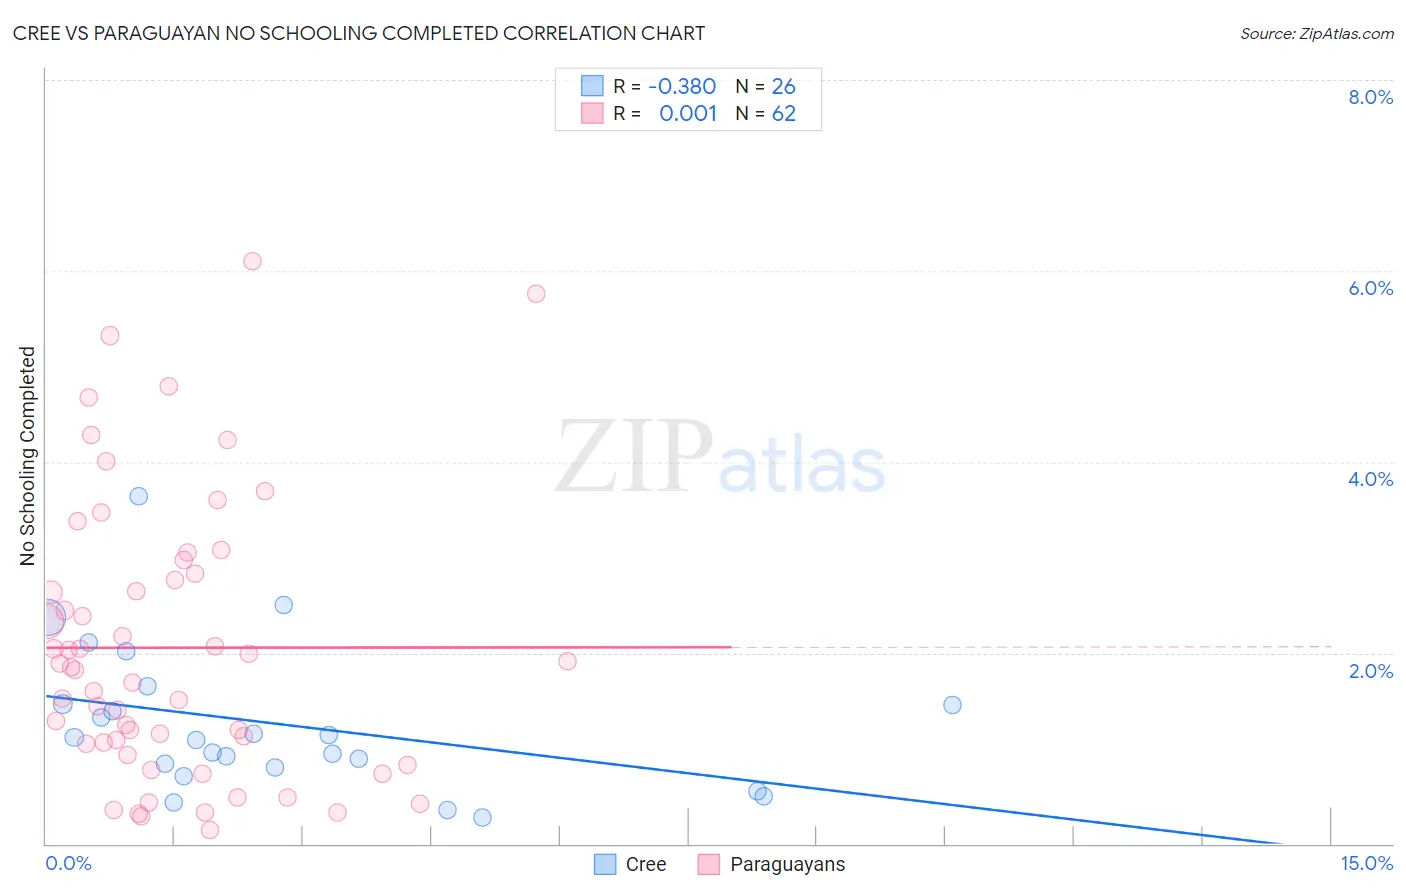
Cree vs Paraguayan No Schooling Completed Correlation Chart
The statistical analysis conducted on geographies consisting of 75,913,844 people shows a mild negative correlation between the proportion of Cree and percentage of population with no schooling in the United States with a correlation coefficient (R) of -0.380 and weighted average of 1.9%. Similarly, the statistical analysis conducted on geographies consisting of 94,864,851 people shows no correlation between the proportion of Paraguayans and percentage of population with no schooling in the United States with a correlation coefficient (R) of 0.001 and weighted average of 2.2%, a difference of 13.8%.
No Schooling Completed Correlation Summary
| Measurement | Cree | Paraguayan |
| Minimum | 0.28% | 0.14% |
| Maximum | 3.6% | 6.1% |
| Range | 3.4% | 6.0% |
| Mean | 1.3% | 2.1% |
| Median | 1.1% | 1.8% |
| Interquartile 25% (IQ1) | 0.80% | 1.0% |
| Interquartile 75% (IQ3) | 1.5% | 2.8% |
| Interquartile Range (IQR) | 0.67% | 1.8% |
| Standard Deviation (Sample) | 0.77% | 1.5% |
| Standard Deviation (Population) | 0.75% | 1.4% |
Similar Demographics by No Schooling Completed
Demographics Similar to Cree by No Schooling Completed
In terms of no schooling completed, the demographic groups most similar to Cree are Immigrants from Croatia (1.9%, a difference of 0.030%), Immigrants from Bulgaria (1.9%, a difference of 0.090%), Immigrants from Kuwait (1.9%, a difference of 0.36%), Cambodian (1.9%, a difference of 0.44%), and Iroquois (1.9%, a difference of 0.50%).
| Demographics | Rating | Rank | No Schooling Completed |
| Syrians | 96.0 /100 | #115 | Exceptional 1.9% |
| Lebanese | 96.0 /100 | #116 | Exceptional 1.9% |
| Immigrants | Serbia | 95.8 /100 | #117 | Exceptional 1.9% |
| Spanish | 95.5 /100 | #118 | Exceptional 1.9% |
| Iroquois | 95.1 /100 | #119 | Exceptional 1.9% |
| Immigrants | Bulgaria | 94.6 /100 | #120 | Exceptional 1.9% |
| Immigrants | Croatia | 94.5 /100 | #121 | Exceptional 1.9% |
| Cree | 94.5 /100 | #122 | Exceptional 1.9% |
| Immigrants | Kuwait | 93.9 /100 | #123 | Exceptional 1.9% |
| Cambodians | 93.8 /100 | #124 | Exceptional 1.9% |
| Immigrants | Europe | 93.7 /100 | #125 | Exceptional 1.9% |
| Immigrants | Romania | 92.6 /100 | #126 | Exceptional 1.9% |
| Israelis | 92.4 /100 | #127 | Exceptional 1.9% |
| Spaniards | 92.3 /100 | #128 | Exceptional 1.9% |
| Seminole | 92.0 /100 | #129 | Exceptional 1.9% |
Demographics Similar to Paraguayans by No Schooling Completed
In terms of no schooling completed, the demographic groups most similar to Paraguayans are Guamanian/Chamorro (2.2%, a difference of 0.080%), Immigrants from Albania (2.2%, a difference of 0.17%), Bermudan (2.1%, a difference of 0.21%), Hawaiian (2.2%, a difference of 0.37%), and Spanish American (2.1%, a difference of 0.51%).
| Demographics | Rating | Rank | No Schooling Completed |
| Immigrants | Bosnia and Herzegovina | 38.6 /100 | #186 | Fair 2.1% |
| Navajo | 36.5 /100 | #187 | Fair 2.1% |
| Immigrants | Kenya | 36.2 /100 | #188 | Fair 2.1% |
| Immigrants | Egypt | 36.1 /100 | #189 | Fair 2.1% |
| Spanish Americans | 32.6 /100 | #190 | Fair 2.1% |
| Bermudans | 30.7 /100 | #191 | Fair 2.1% |
| Guamanians/Chamorros | 29.8 /100 | #192 | Fair 2.2% |
| Paraguayans | 29.3 /100 | #193 | Fair 2.2% |
| Immigrants | Albania | 28.3 /100 | #194 | Fair 2.2% |
| Hawaiians | 27.0 /100 | #195 | Fair 2.2% |
| Immigrants | Ukraine | 26.1 /100 | #196 | Fair 2.2% |
| Immigrants | Southern Europe | 23.8 /100 | #197 | Fair 2.2% |
| Immigrants | Chile | 22.7 /100 | #198 | Fair 2.2% |
| Africans | 21.8 /100 | #199 | Fair 2.2% |
| Immigrants | Northern Africa | 19.5 /100 | #200 | Poor 2.2% |