American vs Paraguayan No Schooling Completed
COMPARE
American
Paraguayan
No Schooling Completed
No Schooling Completed Comparison
Americans
Paraguayans
1.7%
NO SCHOOLING COMPLETED
99.8/ 100
METRIC RATING
60th/ 347
METRIC RANK
2.2%
NO SCHOOLING COMPLETED
29.3/ 100
METRIC RATING
193rd/ 347
METRIC RANK
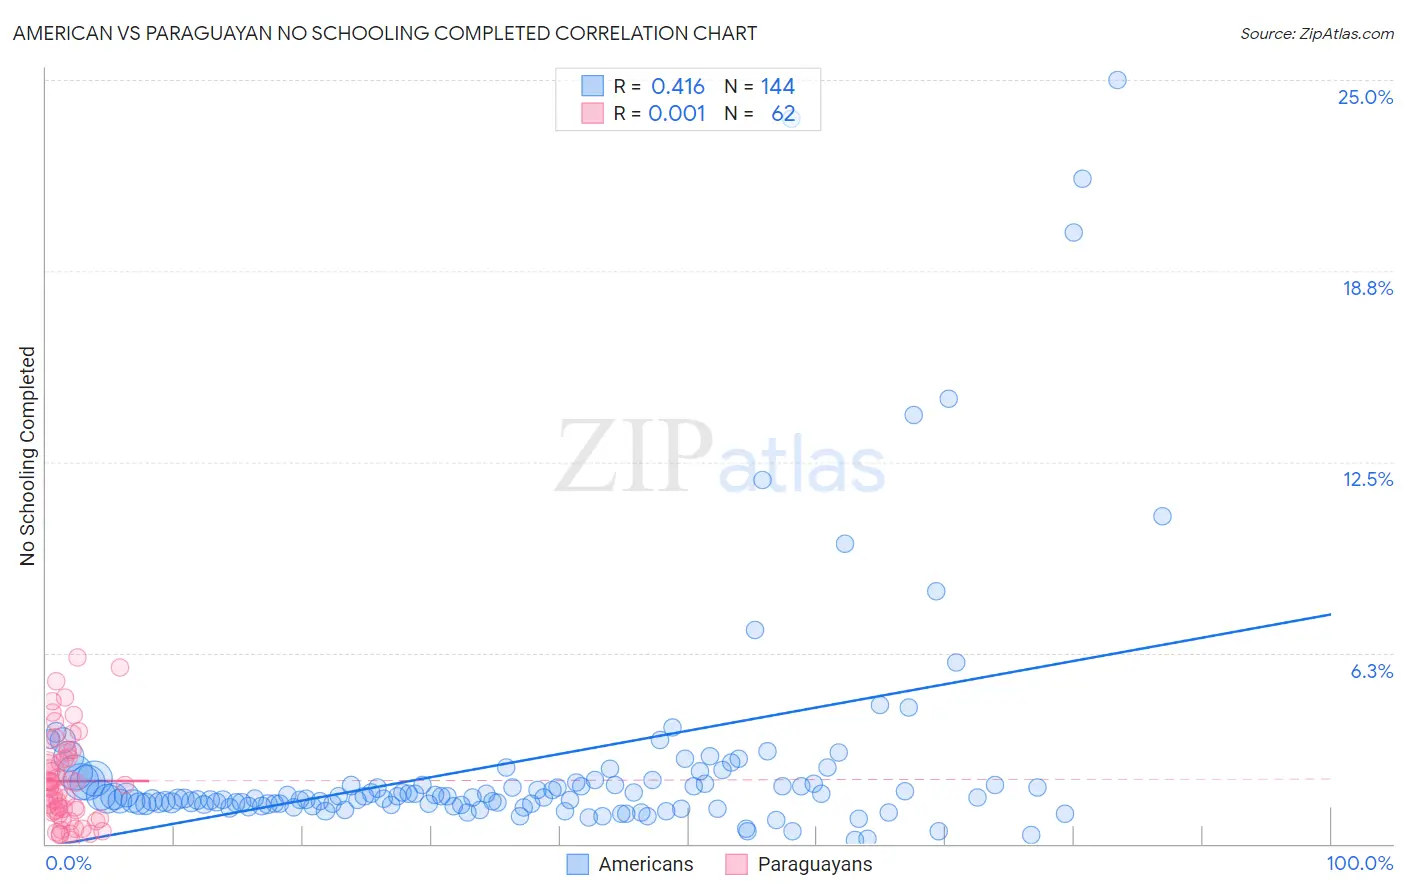
American vs Paraguayan No Schooling Completed Correlation Chart
The statistical analysis conducted on geographies consisting of 561,195,336 people shows a moderate positive correlation between the proportion of Americans and percentage of population with no schooling in the United States with a correlation coefficient (R) of 0.416 and weighted average of 1.7%. Similarly, the statistical analysis conducted on geographies consisting of 94,864,851 people shows no correlation between the proportion of Paraguayans and percentage of population with no schooling in the United States with a correlation coefficient (R) of 0.001 and weighted average of 2.2%, a difference of 30.3%.
No Schooling Completed Correlation Summary
| Measurement | American | Paraguayan |
| Minimum | 0.13% | 0.14% |
| Maximum | 25.0% | 6.1% |
| Range | 24.9% | 6.0% |
| Mean | 2.7% | 2.1% |
| Median | 1.5% | 1.8% |
| Interquartile 25% (IQ1) | 1.3% | 1.0% |
| Interquartile 75% (IQ3) | 2.0% | 2.8% |
| Interquartile Range (IQR) | 0.72% | 1.8% |
| Standard Deviation (Sample) | 4.1% | 1.5% |
| Standard Deviation (Population) | 4.0% | 1.4% |
Similar Demographics by No Schooling Completed
Demographics Similar to Americans by No Schooling Completed
In terms of no schooling completed, the demographic groups most similar to Americans are Slavic (1.7%, a difference of 0.12%), Kiowa (1.6%, a difference of 0.19%), Tsimshian (1.7%, a difference of 0.29%), Austrian (1.6%, a difference of 0.35%), and Greek (1.6%, a difference of 0.66%).
| Demographics | Rating | Rank | No Schooling Completed |
| Creek | 99.8 /100 | #53 | Exceptional 1.6% |
| Crow | 99.8 /100 | #54 | Exceptional 1.6% |
| Greeks | 99.8 /100 | #55 | Exceptional 1.6% |
| Immigrants | North America | 99.8 /100 | #56 | Exceptional 1.6% |
| Austrians | 99.8 /100 | #57 | Exceptional 1.6% |
| Kiowa | 99.8 /100 | #58 | Exceptional 1.6% |
| Slavs | 99.8 /100 | #59 | Exceptional 1.7% |
| Americans | 99.8 /100 | #60 | Exceptional 1.7% |
| Tsimshian | 99.8 /100 | #61 | Exceptional 1.7% |
| Immigrants | Northern Europe | 99.8 /100 | #62 | Exceptional 1.7% |
| Russians | 99.8 /100 | #63 | Exceptional 1.7% |
| New Zealanders | 99.7 /100 | #64 | Exceptional 1.7% |
| Serbians | 99.7 /100 | #65 | Exceptional 1.7% |
| Canadians | 99.7 /100 | #66 | Exceptional 1.7% |
| Immigrants | Austria | 99.7 /100 | #67 | Exceptional 1.7% |
Demographics Similar to Paraguayans by No Schooling Completed
In terms of no schooling completed, the demographic groups most similar to Paraguayans are Guamanian/Chamorro (2.2%, a difference of 0.080%), Immigrants from Albania (2.2%, a difference of 0.17%), Bermudan (2.1%, a difference of 0.21%), Hawaiian (2.2%, a difference of 0.37%), and Spanish American (2.1%, a difference of 0.51%).
| Demographics | Rating | Rank | No Schooling Completed |
| Immigrants | Bosnia and Herzegovina | 38.6 /100 | #186 | Fair 2.1% |
| Navajo | 36.5 /100 | #187 | Fair 2.1% |
| Immigrants | Kenya | 36.2 /100 | #188 | Fair 2.1% |
| Immigrants | Egypt | 36.1 /100 | #189 | Fair 2.1% |
| Spanish Americans | 32.6 /100 | #190 | Fair 2.1% |
| Bermudans | 30.7 /100 | #191 | Fair 2.1% |
| Guamanians/Chamorros | 29.8 /100 | #192 | Fair 2.2% |
| Paraguayans | 29.3 /100 | #193 | Fair 2.2% |
| Immigrants | Albania | 28.3 /100 | #194 | Fair 2.2% |
| Hawaiians | 27.0 /100 | #195 | Fair 2.2% |
| Immigrants | Ukraine | 26.1 /100 | #196 | Fair 2.2% |
| Immigrants | Southern Europe | 23.8 /100 | #197 | Fair 2.2% |
| Immigrants | Chile | 22.7 /100 | #198 | Fair 2.2% |
| Africans | 21.8 /100 | #199 | Fair 2.2% |
| Immigrants | Northern Africa | 19.5 /100 | #200 | Poor 2.2% |