Comanche vs Spanish American College, Under 1 year
COMPARE
Comanche
Spanish American
College, Under 1 year
College, Under 1 year Comparison
Comanche
Spanish Americans
61.4%
COLLEGE, UNDER 1 YEAR
0.4/ 100
METRIC RATING
255th/ 347
METRIC RANK
62.6%
COLLEGE, UNDER 1 YEAR
1.9/ 100
METRIC RATING
235th/ 347
METRIC RANK
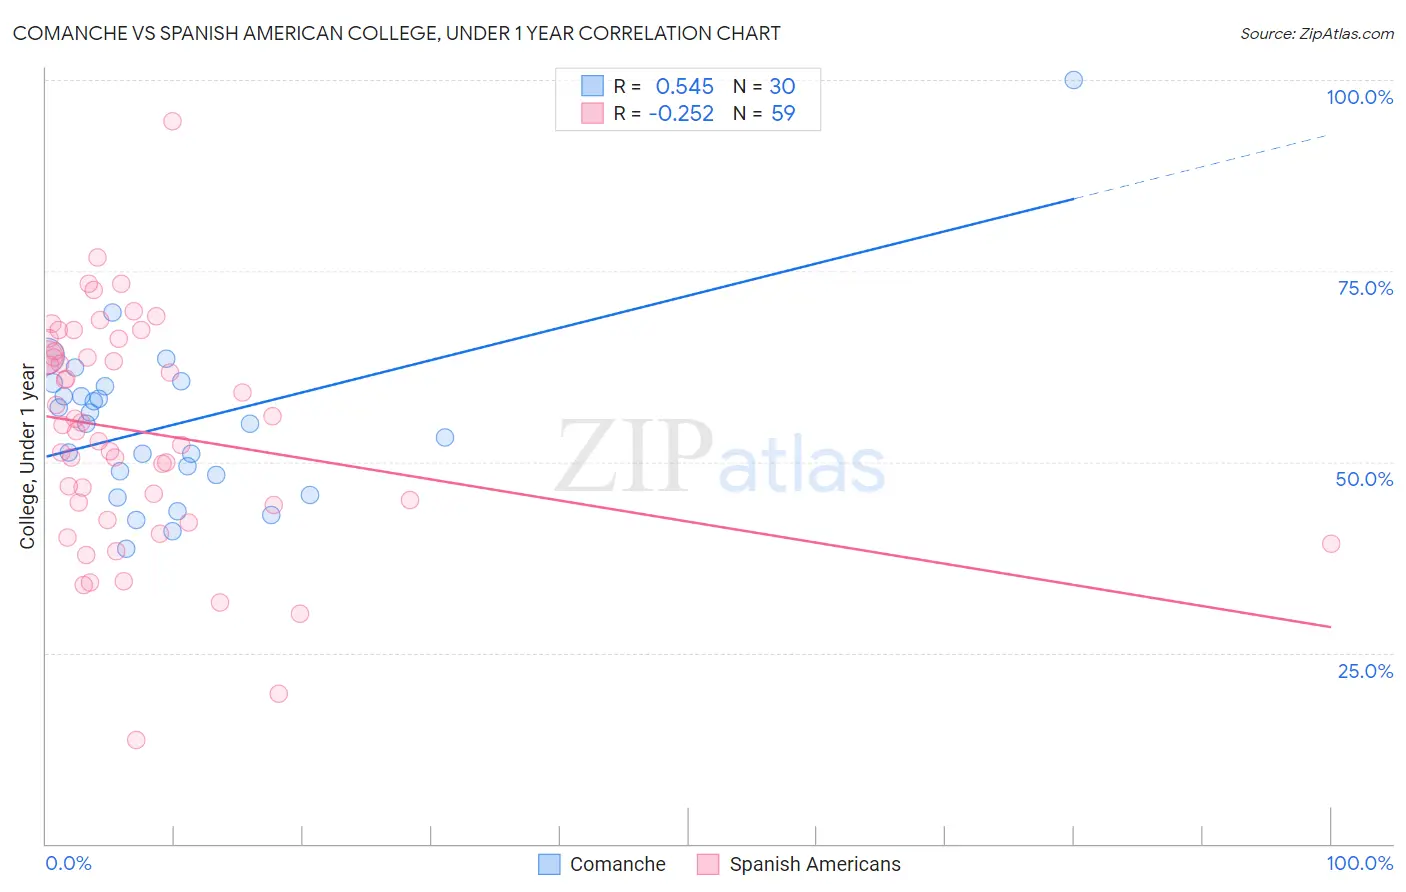
Comanche vs Spanish American College, Under 1 year Correlation Chart
The statistical analysis conducted on geographies consisting of 109,786,512 people shows a substantial positive correlation between the proportion of Comanche and percentage of population with at least college, under 1 year education in the United States with a correlation coefficient (R) of 0.545 and weighted average of 61.4%. Similarly, the statistical analysis conducted on geographies consisting of 103,168,410 people shows a weak negative correlation between the proportion of Spanish Americans and percentage of population with at least college, under 1 year education in the United States with a correlation coefficient (R) of -0.252 and weighted average of 62.6%, a difference of 1.9%.
College, Under 1 year Correlation Summary
| Measurement | Comanche | Spanish American |
| Minimum | 38.6% | 13.6% |
| Maximum | 100.0% | 94.7% |
| Range | 61.4% | 81.0% |
| Mean | 55.0% | 53.9% |
| Median | 54.9% | 54.9% |
| Interquartile 25% (IQ1) | 48.4% | 44.3% |
| Interquartile 75% (IQ3) | 60.0% | 64.5% |
| Interquartile Range (IQR) | 11.6% | 20.2% |
| Standard Deviation (Sample) | 11.5% | 14.8% |
| Standard Deviation (Population) | 11.3% | 14.7% |
Demographics Similar to Comanche and Spanish Americans by College, Under 1 year
In terms of college, under 1 year, the demographic groups most similar to Comanche are Immigrants from Cambodia (61.5%, a difference of 0.12%), West Indian (61.5%, a difference of 0.13%), Japanese (61.5%, a difference of 0.13%), Immigrants from Micronesia (61.5%, a difference of 0.24%), and Immigrants from Congo (61.7%, a difference of 0.42%). Similarly, the demographic groups most similar to Spanish Americans are Immigrants (62.5%, a difference of 0.13%), Immigrants from Burma/Myanmar (62.5%, a difference of 0.16%), French American Indian (62.4%, a difference of 0.25%), Nepalese (62.2%, a difference of 0.59%), and Aleut (62.2%, a difference of 0.60%).
| Demographics | Rating | Rank | College, Under 1 year |
| Spanish Americans | 1.9 /100 | #235 | Tragic 62.6% |
| Immigrants | Immigrants | 1.7 /100 | #236 | Tragic 62.5% |
| Immigrants | Burma/Myanmar | 1.6 /100 | #237 | Tragic 62.5% |
| French American Indians | 1.5 /100 | #238 | Tragic 62.4% |
| Nepalese | 1.1 /100 | #239 | Tragic 62.2% |
| Aleuts | 1.1 /100 | #240 | Tragic 62.2% |
| Ottawa | 1.1 /100 | #241 | Tragic 62.2% |
| Malaysians | 1.1 /100 | #242 | Tragic 62.2% |
| Hawaiians | 1.1 /100 | #243 | Tragic 62.1% |
| Colville | 1.0 /100 | #244 | Tragic 62.1% |
| Delaware | 0.9 /100 | #245 | Tragic 62.1% |
| Marshallese | 0.8 /100 | #246 | Tragic 61.9% |
| Immigrants | Liberia | 0.8 /100 | #247 | Tragic 61.9% |
| Potawatomi | 0.6 /100 | #248 | Tragic 61.8% |
| Vietnamese | 0.5 /100 | #249 | Tragic 61.7% |
| Immigrants | Congo | 0.5 /100 | #250 | Tragic 61.7% |
| Immigrants | Micronesia | 0.5 /100 | #251 | Tragic 61.5% |
| West Indians | 0.4 /100 | #252 | Tragic 61.5% |
| Japanese | 0.4 /100 | #253 | Tragic 61.5% |
| Immigrants | Cambodia | 0.4 /100 | #254 | Tragic 61.5% |
| Comanche | 0.4 /100 | #255 | Tragic 61.4% |