Colville vs Immigrants from Oceania Associate's Degree
COMPARE
Colville
Immigrants from Oceania
Associate's Degree
Associate's Degree Comparison
Colville
Immigrants from Oceania
38.5%
ASSOCIATE'S DEGREE
0.0/ 100
METRIC RATING
302nd/ 347
METRIC RANK
45.8%
ASSOCIATE'S DEGREE
34.7/ 100
METRIC RATING
189th/ 347
METRIC RANK
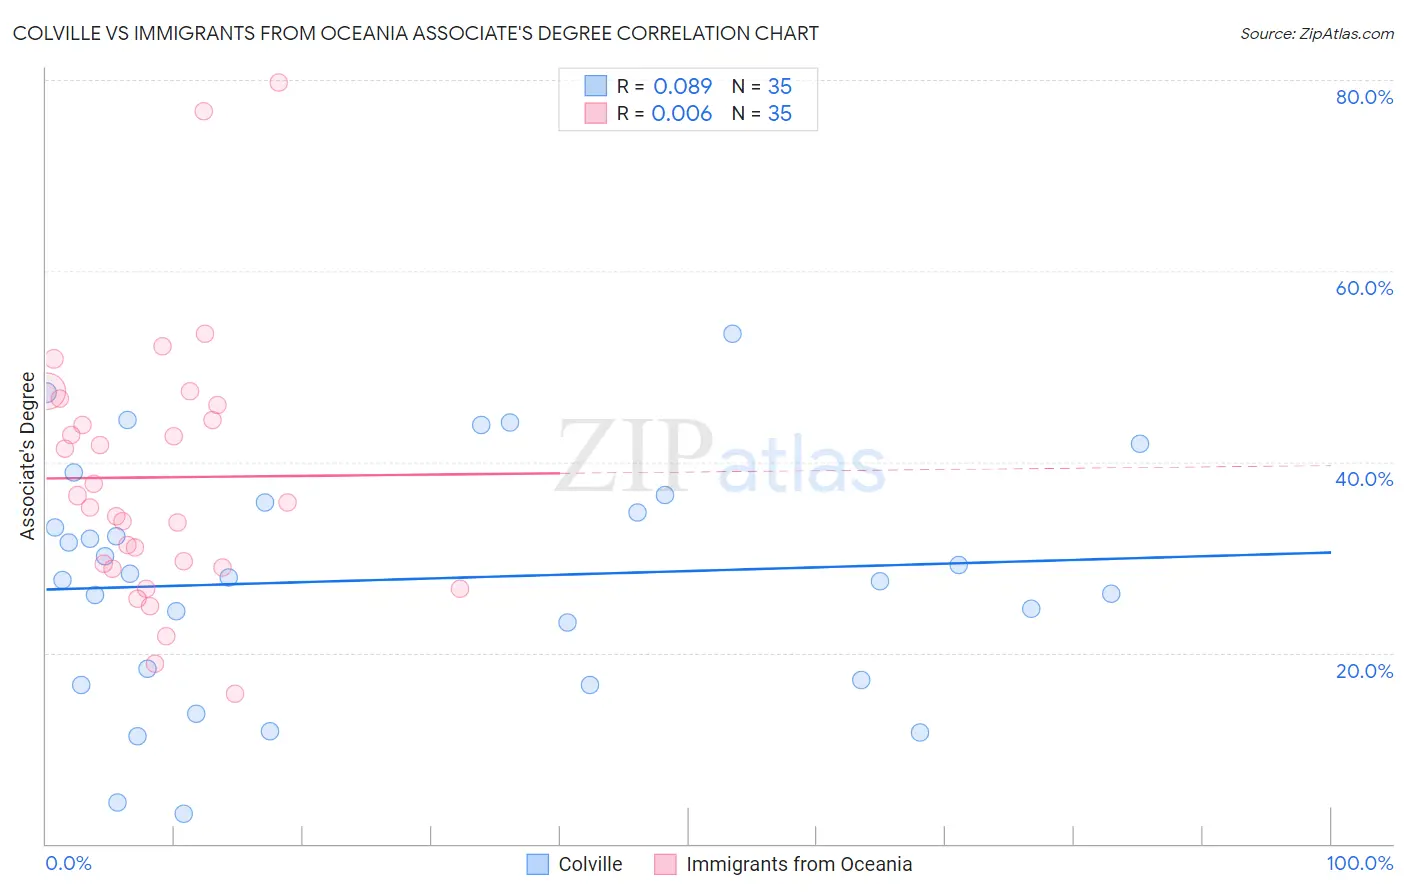
Colville vs Immigrants from Oceania Associate's Degree Correlation Chart
The statistical analysis conducted on geographies consisting of 34,684,410 people shows a slight positive correlation between the proportion of Colville and percentage of population with at least associate's degree education in the United States with a correlation coefficient (R) of 0.089 and weighted average of 38.5%. Similarly, the statistical analysis conducted on geographies consisting of 305,516,094 people shows no correlation between the proportion of Immigrants from Oceania and percentage of population with at least associate's degree education in the United States with a correlation coefficient (R) of 0.006 and weighted average of 45.8%, a difference of 18.9%.
Associate's Degree Correlation Summary
| Measurement | Colville | Immigrants from Oceania |
| Minimum | 3.2% | 15.7% |
| Maximum | 53.4% | 79.8% |
| Range | 50.2% | 64.1% |
| Mean | 27.7% | 38.4% |
| Median | 27.9% | 35.7% |
| Interquartile 25% (IQ1) | 17.1% | 28.9% |
| Interquartile 75% (IQ3) | 35.8% | 46.0% |
| Interquartile Range (IQR) | 18.7% | 17.0% |
| Standard Deviation (Sample) | 12.2% | 13.8% |
| Standard Deviation (Population) | 12.1% | 13.6% |
Similar Demographics by Associate's Degree
Demographics Similar to Colville by Associate's Degree
In terms of associate's degree, the demographic groups most similar to Colville are Guatemalan (38.5%, a difference of 0.090%), Sioux (38.5%, a difference of 0.14%), Tsimshian (38.6%, a difference of 0.15%), Chickasaw (38.6%, a difference of 0.20%), and Immigrants from Honduras (38.5%, a difference of 0.21%).
| Demographics | Rating | Rank | Associate's Degree |
| Hondurans | 0.0 /100 | #295 | Tragic 38.9% |
| Cherokee | 0.0 /100 | #296 | Tragic 38.9% |
| Cape Verdeans | 0.0 /100 | #297 | Tragic 38.8% |
| Cheyenne | 0.0 /100 | #298 | Tragic 38.7% |
| Ute | 0.0 /100 | #299 | Tragic 38.6% |
| Chickasaw | 0.0 /100 | #300 | Tragic 38.6% |
| Tsimshian | 0.0 /100 | #301 | Tragic 38.6% |
| Colville | 0.0 /100 | #302 | Tragic 38.5% |
| Guatemalans | 0.0 /100 | #303 | Tragic 38.5% |
| Sioux | 0.0 /100 | #304 | Tragic 38.5% |
| Immigrants | Honduras | 0.0 /100 | #305 | Tragic 38.5% |
| Shoshone | 0.0 /100 | #306 | Tragic 38.4% |
| Immigrants | El Salvador | 0.0 /100 | #307 | Tragic 38.4% |
| Mexican American Indians | 0.0 /100 | #308 | Tragic 38.2% |
| Immigrants | Guatemala | 0.0 /100 | #309 | Tragic 38.1% |
Demographics Similar to Immigrants from Oceania by Associate's Degree
In terms of associate's degree, the demographic groups most similar to Immigrants from Oceania are Immigrants from Uruguay (45.8%, a difference of 0.060%), Ghanaian (45.8%, a difference of 0.060%), Vietnamese (45.8%, a difference of 0.060%), Korean (45.8%, a difference of 0.070%), and Celtic (45.8%, a difference of 0.12%).
| Demographics | Rating | Rank | Associate's Degree |
| Swiss | 40.4 /100 | #182 | Average 46.0% |
| Yugoslavians | 40.2 /100 | #183 | Average 46.0% |
| Czechoslovakians | 40.0 /100 | #184 | Average 46.0% |
| Costa Ricans | 38.6 /100 | #185 | Fair 46.0% |
| Welsh | 37.9 /100 | #186 | Fair 45.9% |
| Immigrants | Uruguay | 35.5 /100 | #187 | Fair 45.8% |
| Ghanaians | 35.5 /100 | #188 | Fair 45.8% |
| Immigrants | Oceania | 34.7 /100 | #189 | Fair 45.8% |
| Vietnamese | 34.0 /100 | #190 | Fair 45.8% |
| Koreans | 33.8 /100 | #191 | Fair 45.8% |
| Celtics | 33.3 /100 | #192 | Fair 45.8% |
| Immigrants | Cameroon | 31.0 /100 | #193 | Fair 45.7% |
| Immigrants | Peru | 27.6 /100 | #194 | Fair 45.5% |
| Germans | 26.5 /100 | #195 | Fair 45.5% |
| French | 25.6 /100 | #196 | Fair 45.4% |