Choctaw vs Spanish No Schooling Completed
COMPARE
Choctaw
Spanish
No Schooling Completed
No Schooling Completed Comparison
Choctaw
Spanish
1.8%
NO SCHOOLING COMPLETED
98.1/ 100
METRIC RATING
99th/ 347
METRIC RANK
1.9%
NO SCHOOLING COMPLETED
95.5/ 100
METRIC RATING
118th/ 347
METRIC RANK
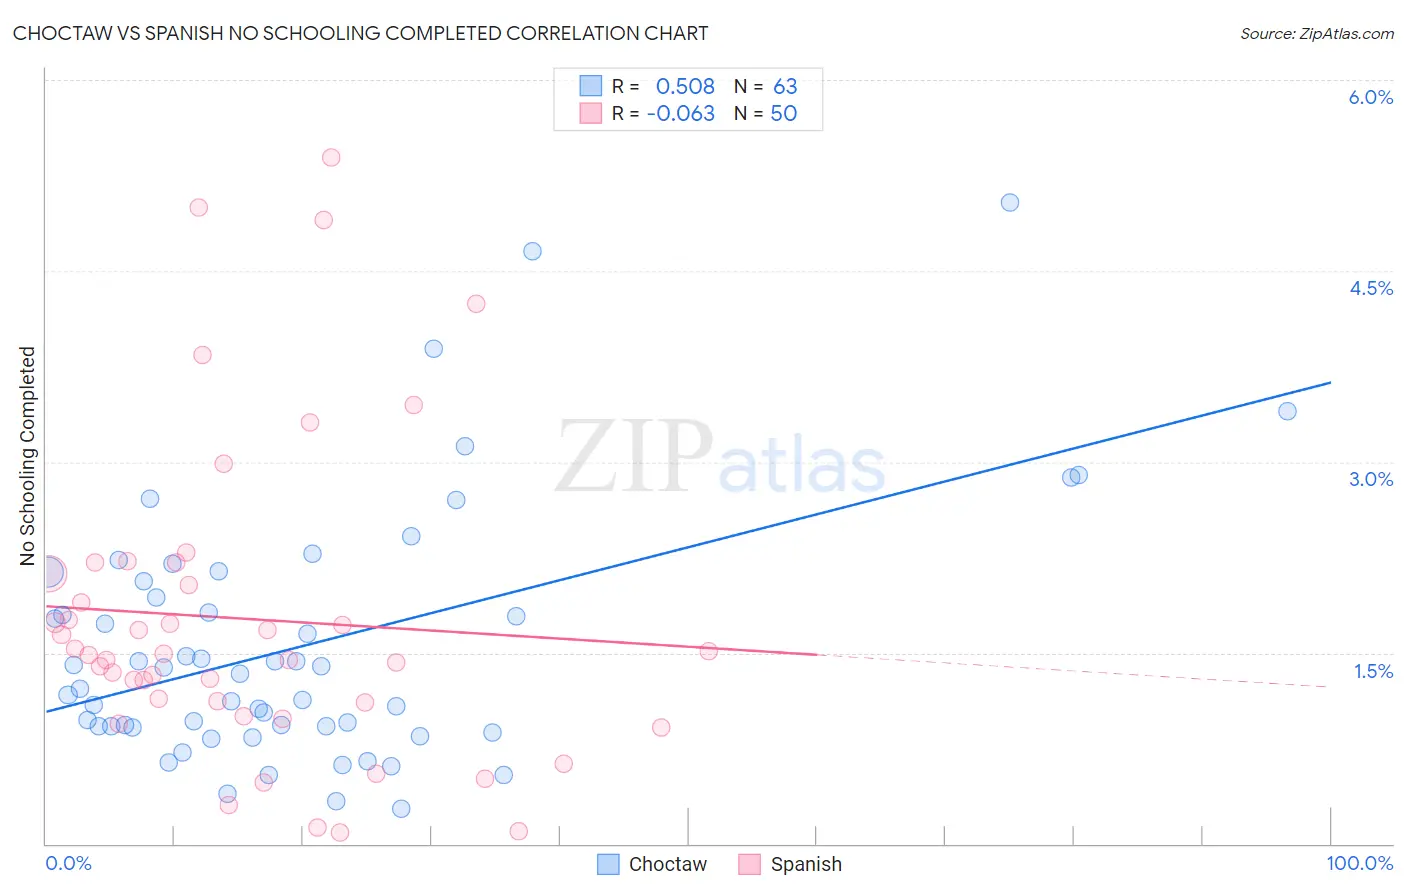
Choctaw vs Spanish No Schooling Completed Correlation Chart
The statistical analysis conducted on geographies consisting of 267,452,860 people shows a substantial positive correlation between the proportion of Choctaw and percentage of population with no schooling in the United States with a correlation coefficient (R) of 0.508 and weighted average of 1.8%. Similarly, the statistical analysis conducted on geographies consisting of 416,846,352 people shows a slight negative correlation between the proportion of Spanish and percentage of population with no schooling in the United States with a correlation coefficient (R) of -0.063 and weighted average of 1.9%, a difference of 3.5%.
No Schooling Completed Correlation Summary
| Measurement | Choctaw | Spanish |
| Minimum | 0.27% | 0.088% |
| Maximum | 5.0% | 5.4% |
| Range | 4.8% | 5.3% |
| Mean | 1.6% | 1.8% |
| Median | 1.3% | 1.5% |
| Interquartile 25% (IQ1) | 0.92% | 1.1% |
| Interquartile 75% (IQ3) | 2.1% | 2.1% |
| Interquartile Range (IQR) | 1.1% | 1.0% |
| Standard Deviation (Sample) | 0.99% | 1.2% |
| Standard Deviation (Population) | 0.98% | 1.2% |
Demographics Similar to Choctaw and Spanish by No Schooling Completed
In terms of no schooling completed, the demographic groups most similar to Choctaw are Iranian (1.8%, a difference of 0.19%), Immigrants from Singapore (1.8%, a difference of 0.20%), Immigrants from Czechoslovakia (1.8%, a difference of 0.49%), Immigrants from Switzerland (1.8%, a difference of 0.50%), and Basque (1.8%, a difference of 0.55%). Similarly, the demographic groups most similar to Spanish are Immigrants from Serbia (1.9%, a difference of 0.24%), Lebanese (1.9%, a difference of 0.44%), Syrian (1.9%, a difference of 0.46%), Immigrants from Norway (1.9%, a difference of 0.59%), and Immigrants from Zimbabwe (1.9%, a difference of 0.60%).
| Demographics | Rating | Rank | No Schooling Completed |
| Iranians | 98.2 /100 | #98 | Exceptional 1.8% |
| Choctaw | 98.1 /100 | #99 | Exceptional 1.8% |
| Immigrants | Singapore | 98.0 /100 | #100 | Exceptional 1.8% |
| Immigrants | Czechoslovakia | 97.9 /100 | #101 | Exceptional 1.8% |
| Immigrants | Switzerland | 97.9 /100 | #102 | Exceptional 1.8% |
| Basques | 97.9 /100 | #103 | Exceptional 1.8% |
| Thais | 97.5 /100 | #104 | Exceptional 1.8% |
| German Russians | 97.5 /100 | #105 | Exceptional 1.8% |
| Immigrants | France | 97.3 /100 | #106 | Exceptional 1.8% |
| Yugoslavians | 97.2 /100 | #107 | Exceptional 1.8% |
| Okinawans | 97.1 /100 | #108 | Exceptional 1.8% |
| Immigrants | Saudi Arabia | 96.8 /100 | #109 | Exceptional 1.9% |
| Immigrants | Latvia | 96.7 /100 | #110 | Exceptional 1.9% |
| Immigrants | Japan | 96.6 /100 | #111 | Exceptional 1.9% |
| Pueblo | 96.4 /100 | #112 | Exceptional 1.9% |
| Immigrants | Zimbabwe | 96.2 /100 | #113 | Exceptional 1.9% |
| Immigrants | Norway | 96.1 /100 | #114 | Exceptional 1.9% |
| Syrians | 96.0 /100 | #115 | Exceptional 1.9% |
| Lebanese | 96.0 /100 | #116 | Exceptional 1.9% |
| Immigrants | Serbia | 95.8 /100 | #117 | Exceptional 1.9% |
| Spanish | 95.5 /100 | #118 | Exceptional 1.9% |