Choctaw vs Immigrants from Nicaragua No Schooling Completed
COMPARE
Choctaw
Immigrants from Nicaragua
No Schooling Completed
No Schooling Completed Comparison
Choctaw
Immigrants from Nicaragua
1.8%
NO SCHOOLING COMPLETED
98.1/ 100
METRIC RATING
99th/ 347
METRIC RANK
3.1%
NO SCHOOLING COMPLETED
0.0/ 100
METRIC RATING
315th/ 347
METRIC RANK
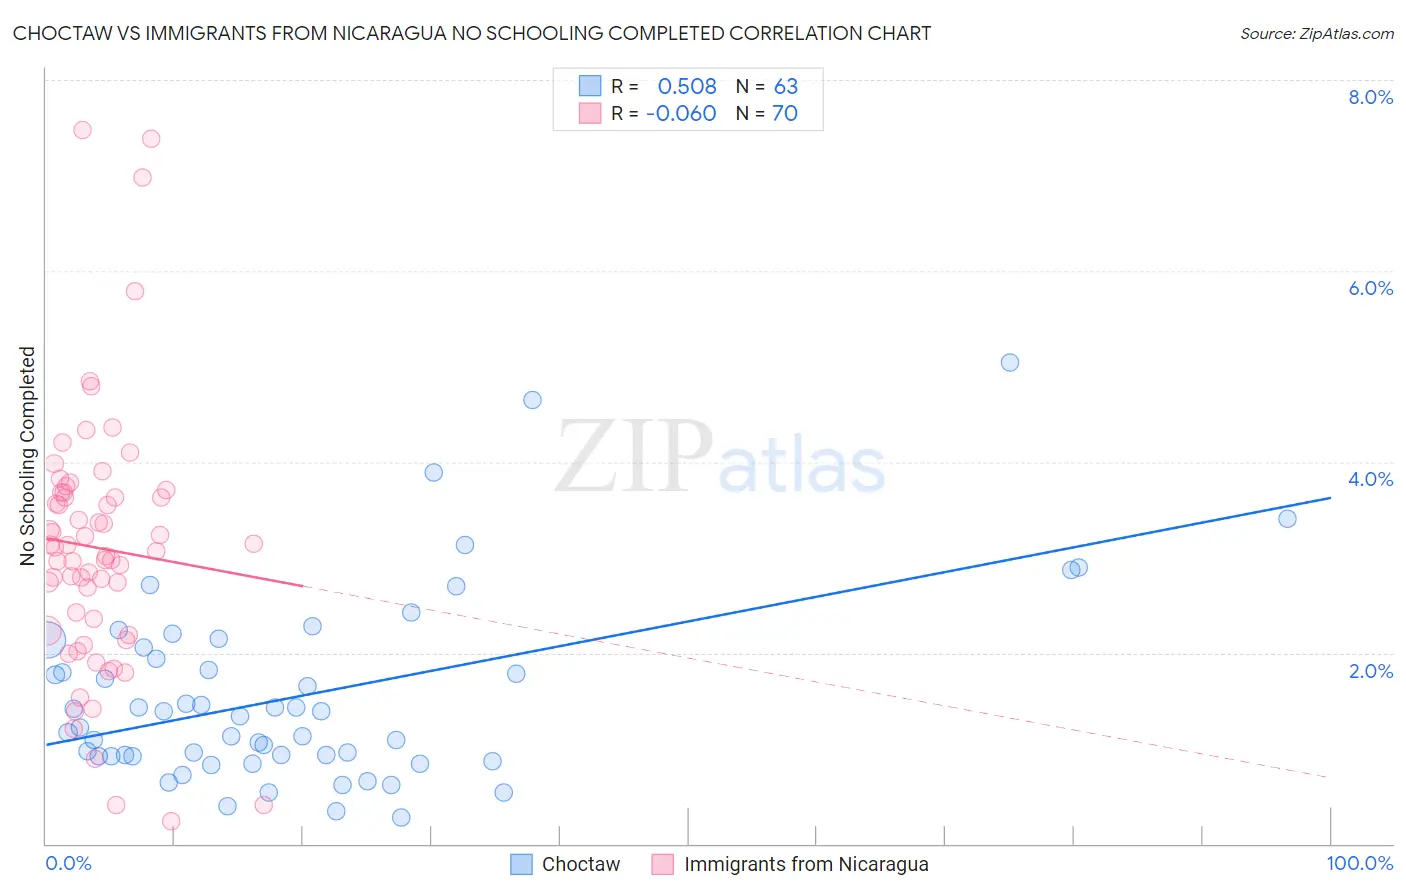
Choctaw vs Immigrants from Nicaragua No Schooling Completed Correlation Chart
The statistical analysis conducted on geographies consisting of 267,452,860 people shows a substantial positive correlation between the proportion of Choctaw and percentage of population with no schooling in the United States with a correlation coefficient (R) of 0.508 and weighted average of 1.8%. Similarly, the statistical analysis conducted on geographies consisting of 235,758,389 people shows a slight negative correlation between the proportion of Immigrants from Nicaragua and percentage of population with no schooling in the United States with a correlation coefficient (R) of -0.060 and weighted average of 3.1%, a difference of 69.6%.
No Schooling Completed Correlation Summary
| Measurement | Choctaw | Immigrants from Nicaragua |
| Minimum | 0.27% | 0.23% |
| Maximum | 5.0% | 7.5% |
| Range | 4.8% | 7.2% |
| Mean | 1.6% | 3.1% |
| Median | 1.3% | 3.1% |
| Interquartile 25% (IQ1) | 0.92% | 2.2% |
| Interquartile 75% (IQ3) | 2.1% | 3.7% |
| Interquartile Range (IQR) | 1.1% | 1.4% |
| Standard Deviation (Sample) | 0.99% | 1.4% |
| Standard Deviation (Population) | 0.98% | 1.4% |
Similar Demographics by No Schooling Completed
Demographics Similar to Choctaw by No Schooling Completed
In terms of no schooling completed, the demographic groups most similar to Choctaw are Iranian (1.8%, a difference of 0.19%), Immigrants from Singapore (1.8%, a difference of 0.20%), Immigrants from Ireland (1.8%, a difference of 0.47%), Immigrants from Czechoslovakia (1.8%, a difference of 0.49%), and Immigrants from Switzerland (1.8%, a difference of 0.50%).
| Demographics | Rating | Rank | No Schooling Completed |
| Romanians | 98.8 /100 | #92 | Exceptional 1.8% |
| Turks | 98.7 /100 | #93 | Exceptional 1.8% |
| Immigrants | Nonimmigrants | 98.5 /100 | #94 | Exceptional 1.8% |
| Puget Sound Salish | 98.5 /100 | #95 | Exceptional 1.8% |
| Bhutanese | 98.4 /100 | #96 | Exceptional 1.8% |
| Immigrants | Ireland | 98.4 /100 | #97 | Exceptional 1.8% |
| Iranians | 98.2 /100 | #98 | Exceptional 1.8% |
| Choctaw | 98.1 /100 | #99 | Exceptional 1.8% |
| Immigrants | Singapore | 98.0 /100 | #100 | Exceptional 1.8% |
| Immigrants | Czechoslovakia | 97.9 /100 | #101 | Exceptional 1.8% |
| Immigrants | Switzerland | 97.9 /100 | #102 | Exceptional 1.8% |
| Basques | 97.9 /100 | #103 | Exceptional 1.8% |
| Thais | 97.5 /100 | #104 | Exceptional 1.8% |
| German Russians | 97.5 /100 | #105 | Exceptional 1.8% |
| Immigrants | France | 97.3 /100 | #106 | Exceptional 1.8% |
Demographics Similar to Immigrants from Nicaragua by No Schooling Completed
In terms of no schooling completed, the demographic groups most similar to Immigrants from Nicaragua are Immigrants from Belize (3.1%, a difference of 0.24%), Honduran (3.1%, a difference of 0.33%), Immigrants from Ecuador (3.1%, a difference of 0.36%), Sri Lankan (3.0%, a difference of 0.84%), and Cape Verdean (3.1%, a difference of 0.84%).
| Demographics | Rating | Rank | No Schooling Completed |
| Immigrants | Somalia | 0.0 /100 | #308 | Tragic 3.0% |
| Hispanics or Latinos | 0.0 /100 | #309 | Tragic 3.0% |
| Guyanese | 0.0 /100 | #310 | Tragic 3.0% |
| Immigrants | Azores | 0.0 /100 | #311 | Tragic 3.0% |
| Sri Lankans | 0.0 /100 | #312 | Tragic 3.0% |
| Hondurans | 0.0 /100 | #313 | Tragic 3.1% |
| Immigrants | Belize | 0.0 /100 | #314 | Tragic 3.1% |
| Immigrants | Nicaragua | 0.0 /100 | #315 | Tragic 3.1% |
| Immigrants | Ecuador | 0.0 /100 | #316 | Tragic 3.1% |
| Cape Verdeans | 0.0 /100 | #317 | Tragic 3.1% |
| Immigrants | Guyana | 0.0 /100 | #318 | Tragic 3.1% |
| Immigrants | Burma/Myanmar | 0.0 /100 | #319 | Tragic 3.1% |
| Immigrants | Bangladesh | 0.0 /100 | #320 | Tragic 3.1% |
| Immigrants | Laos | 0.0 /100 | #321 | Tragic 3.1% |
| Immigrants | Honduras | 0.0 /100 | #322 | Tragic 3.2% |