Choctaw vs English College, 1 year or more
COMPARE
Choctaw
English
College, 1 year or more
College, 1 year or more Comparison
Choctaw
English
52.3%
COLLEGE, 1 YEAR OR MORE
0.0/ 100
METRIC RATING
300th/ 347
METRIC RANK
60.0%
COLLEGE, 1 YEAR OR MORE
67.2/ 100
METRIC RATING
158th/ 347
METRIC RANK
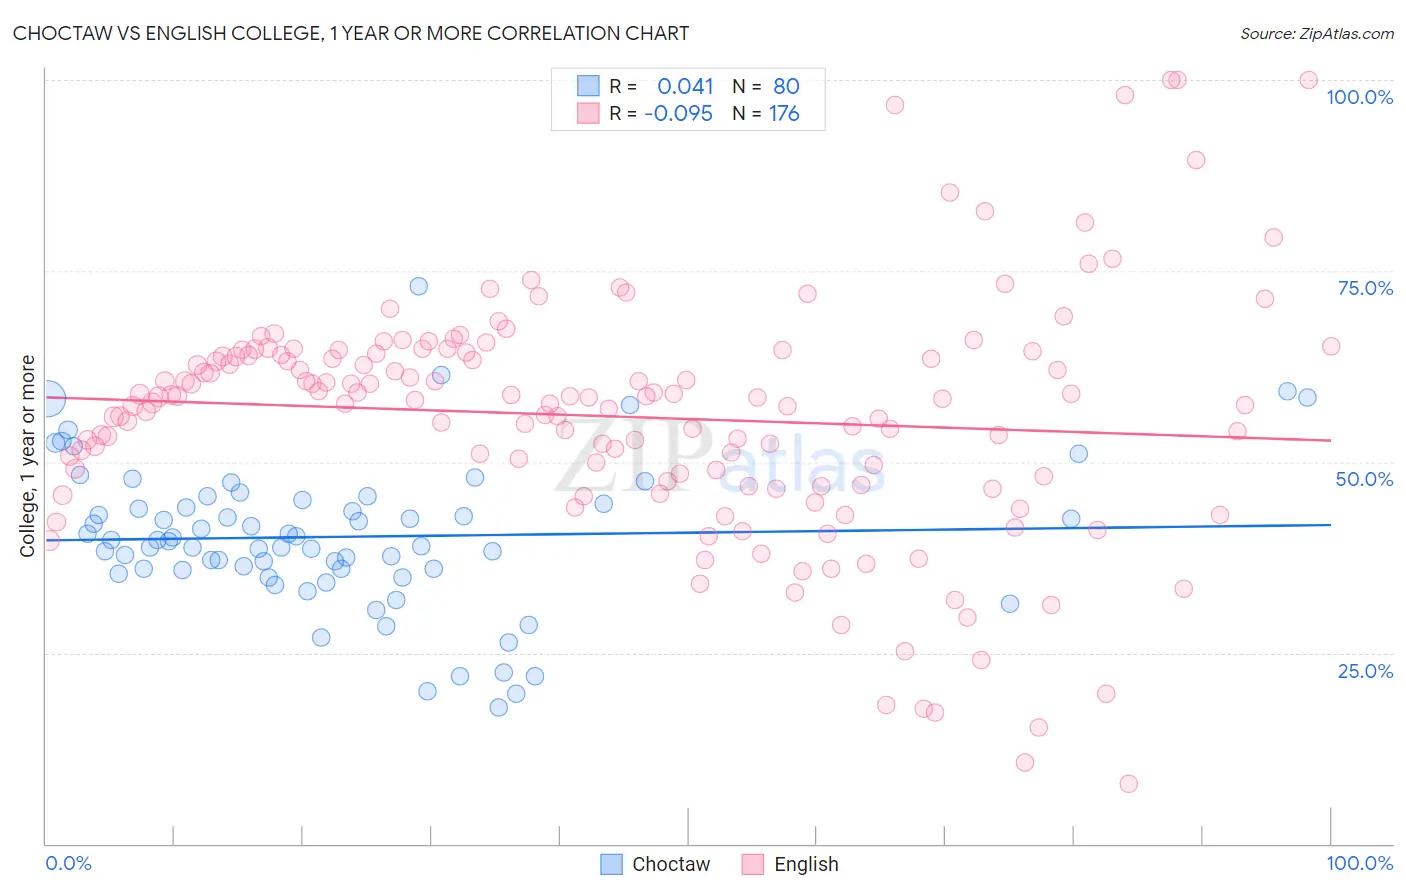
Choctaw vs English College, 1 year or more Correlation Chart
The statistical analysis conducted on geographies consisting of 269,741,564 people shows no correlation between the proportion of Choctaw and percentage of population with at least college, 1 year or more education in the United States with a correlation coefficient (R) of 0.041 and weighted average of 52.3%. Similarly, the statistical analysis conducted on geographies consisting of 579,957,546 people shows a slight negative correlation between the proportion of English and percentage of population with at least college, 1 year or more education in the United States with a correlation coefficient (R) of -0.095 and weighted average of 60.0%, a difference of 14.6%.
College, 1 year or more Correlation Summary
| Measurement | Choctaw | English |
| Minimum | 17.8% | 7.9% |
| Maximum | 73.1% | 100.0% |
| Range | 55.3% | 92.1% |
| Mean | 40.2% | 55.9% |
| Median | 39.7% | 58.3% |
| Interquartile 25% (IQ1) | 35.9% | 47.8% |
| Interquartile 75% (IQ3) | 44.7% | 64.2% |
| Interquartile Range (IQR) | 8.8% | 16.4% |
| Standard Deviation (Sample) | 9.9% | 15.8% |
| Standard Deviation (Population) | 9.8% | 15.8% |
Similar Demographics by College, 1 year or more
Demographics Similar to Choctaw by College, 1 year or more
In terms of college, 1 year or more, the demographic groups most similar to Choctaw are Immigrants from Nicaragua (52.4%, a difference of 0.040%), Haitian (52.3%, a difference of 0.060%), Puerto Rican (52.2%, a difference of 0.19%), Creek (52.2%, a difference of 0.26%), and Immigrants from Dominica (52.5%, a difference of 0.38%).
| Demographics | Rating | Rank | College, 1 year or more |
| Blacks/African Americans | 0.0 /100 | #293 | Tragic 53.3% |
| Cherokee | 0.0 /100 | #294 | Tragic 53.2% |
| Yaqui | 0.0 /100 | #295 | Tragic 53.2% |
| Sioux | 0.0 /100 | #296 | Tragic 53.0% |
| Paiute | 0.0 /100 | #297 | Tragic 52.9% |
| Immigrants | Dominica | 0.0 /100 | #298 | Tragic 52.5% |
| Immigrants | Nicaragua | 0.0 /100 | #299 | Tragic 52.4% |
| Choctaw | 0.0 /100 | #300 | Tragic 52.3% |
| Haitians | 0.0 /100 | #301 | Tragic 52.3% |
| Puerto Ricans | 0.0 /100 | #302 | Tragic 52.2% |
| Creek | 0.0 /100 | #303 | Tragic 52.2% |
| Central Americans | 0.0 /100 | #304 | Tragic 52.1% |
| Seminole | 0.0 /100 | #305 | Tragic 52.1% |
| Mexican American Indians | 0.0 /100 | #306 | Tragic 51.9% |
| Immigrants | Portugal | 0.0 /100 | #307 | Tragic 51.9% |
Demographics Similar to English by College, 1 year or more
In terms of college, 1 year or more, the demographic groups most similar to English are Immigrants from Iraq (60.0%, a difference of 0.010%), South American Indian (60.0%, a difference of 0.020%), Immigrants from Armenia (60.0%, a difference of 0.10%), Somali (59.9%, a difference of 0.15%), and Sudanese (60.2%, a difference of 0.36%).
| Demographics | Rating | Rank | College, 1 year or more |
| Albanians | 77.8 /100 | #151 | Good 60.4% |
| Immigrants | Germany | 76.1 /100 | #152 | Good 60.3% |
| Sierra Leoneans | 74.1 /100 | #153 | Good 60.2% |
| Sudanese | 73.0 /100 | #154 | Good 60.2% |
| Moroccans | 72.9 /100 | #155 | Good 60.2% |
| Finns | 72.9 /100 | #156 | Good 60.2% |
| Immigrants | Armenia | 68.8 /100 | #157 | Good 60.0% |
| English | 67.2 /100 | #158 | Good 60.0% |
| Immigrants | Iraq | 67.0 /100 | #159 | Good 60.0% |
| South American Indians | 66.9 /100 | #160 | Good 60.0% |
| Somalis | 64.5 /100 | #161 | Good 59.9% |
| Koreans | 58.5 /100 | #162 | Average 59.7% |
| Immigrants | Somalia | 58.3 /100 | #163 | Average 59.7% |
| Belgians | 58.1 /100 | #164 | Average 59.7% |
| Irish | 56.1 /100 | #165 | Average 59.6% |