Chilean vs Immigrants from Uganda No Schooling Completed
COMPARE
Chilean
Immigrants from Uganda
No Schooling Completed
No Schooling Completed Comparison
Chileans
Immigrants from Uganda
2.0%
NO SCHOOLING COMPLETED
67.2/ 100
METRIC RATING
156th/ 347
METRIC RANK
2.3%
NO SCHOOLING COMPLETED
4.0/ 100
METRIC RATING
227th/ 347
METRIC RANK
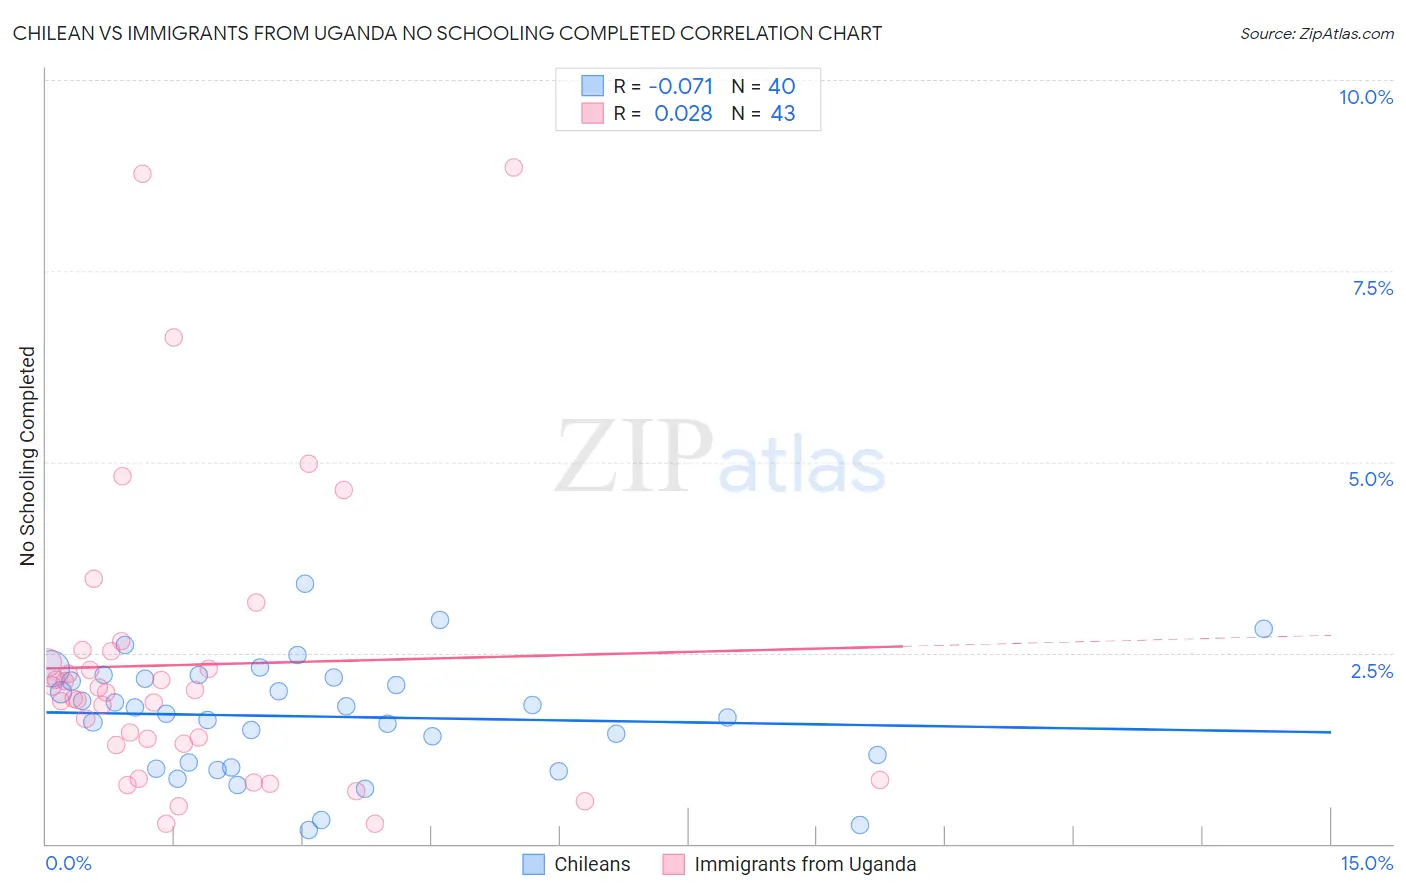
Chilean vs Immigrants from Uganda No Schooling Completed Correlation Chart
The statistical analysis conducted on geographies consisting of 255,430,535 people shows a slight negative correlation between the proportion of Chileans and percentage of population with no schooling in the United States with a correlation coefficient (R) of -0.071 and weighted average of 2.0%. Similarly, the statistical analysis conducted on geographies consisting of 125,578,138 people shows no correlation between the proportion of Immigrants from Uganda and percentage of population with no schooling in the United States with a correlation coefficient (R) of 0.028 and weighted average of 2.3%, a difference of 13.4%.
No Schooling Completed Correlation Summary
| Measurement | Chilean | Immigrants from Uganda |
| Minimum | 0.19% | 0.25% |
| Maximum | 3.4% | 8.8% |
| Range | 3.2% | 8.6% |
| Mean | 1.7% | 2.3% |
| Median | 1.7% | 2.0% |
| Interquartile 25% (IQ1) | 1.0% | 1.3% |
| Interquartile 75% (IQ3) | 2.2% | 2.5% |
| Interquartile Range (IQR) | 1.1% | 1.2% |
| Standard Deviation (Sample) | 0.74% | 1.9% |
| Standard Deviation (Population) | 0.73% | 1.9% |
Similar Demographics by No Schooling Completed
Demographics Similar to Chileans by No Schooling Completed
In terms of no schooling completed, the demographic groups most similar to Chileans are Immigrants from Sri Lanka (2.0%, a difference of 0.030%), Immigrants from Russia (2.0%, a difference of 0.070%), Immigrants from Korea (2.0%, a difference of 0.080%), Immigrants from Spain (2.0%, a difference of 0.12%), and Immigrants from Venezuela (2.0%, a difference of 0.21%).
| Demographics | Rating | Rank | No Schooling Completed |
| Immigrants | North Macedonia | 75.9 /100 | #149 | Good 2.0% |
| Blackfeet | 72.9 /100 | #150 | Good 2.0% |
| Immigrants | Jordan | 70.9 /100 | #151 | Good 2.0% |
| Immigrants | Eastern Europe | 70.4 /100 | #152 | Good 2.0% |
| Immigrants | Italy | 68.9 /100 | #153 | Good 2.0% |
| Immigrants | Venezuela | 68.5 /100 | #154 | Good 2.0% |
| Immigrants | Russia | 67.6 /100 | #155 | Good 2.0% |
| Chileans | 67.2 /100 | #156 | Good 2.0% |
| Immigrants | Sri Lanka | 67.0 /100 | #157 | Good 2.0% |
| Immigrants | Korea | 66.7 /100 | #158 | Good 2.0% |
| Immigrants | Spain | 66.4 /100 | #159 | Good 2.0% |
| Kenyans | 65.7 /100 | #160 | Good 2.0% |
| Ugandans | 64.6 /100 | #161 | Good 2.0% |
| Immigrants | Brazil | 63.8 /100 | #162 | Good 2.1% |
| Albanians | 62.2 /100 | #163 | Good 2.1% |
Demographics Similar to Immigrants from Uganda by No Schooling Completed
In terms of no schooling completed, the demographic groups most similar to Immigrants from Uganda are Sierra Leonean (2.3%, a difference of 0.060%), Tohono O'odham (2.3%, a difference of 0.070%), Sudanese (2.3%, a difference of 0.070%), U.S. Virgin Islander (2.3%, a difference of 0.29%), and Immigrants from Lebanon (2.3%, a difference of 0.36%).
| Demographics | Rating | Rank | No Schooling Completed |
| Immigrants | Costa Rica | 5.1 /100 | #220 | Tragic 2.3% |
| Immigrants | Sudan | 5.0 /100 | #221 | Tragic 2.3% |
| Sub-Saharan Africans | 4.7 /100 | #222 | Tragic 2.3% |
| Immigrants | Lebanon | 4.5 /100 | #223 | Tragic 2.3% |
| Tohono O'odham | 4.1 /100 | #224 | Tragic 2.3% |
| Sudanese | 4.1 /100 | #225 | Tragic 2.3% |
| Sierra Leoneans | 4.1 /100 | #226 | Tragic 2.3% |
| Immigrants | Uganda | 4.0 /100 | #227 | Tragic 2.3% |
| U.S. Virgin Islanders | 3.7 /100 | #228 | Tragic 2.3% |
| Immigrants | Pakistan | 3.6 /100 | #229 | Tragic 2.3% |
| Puerto Ricans | 3.4 /100 | #230 | Tragic 2.3% |
| Immigrants | Uruguay | 3.4 /100 | #231 | Tragic 2.3% |
| Colombians | 3.2 /100 | #232 | Tragic 2.3% |
| Immigrants | Malaysia | 2.8 /100 | #233 | Tragic 2.3% |
| Nigerians | 2.6 /100 | #234 | Tragic 2.3% |