Chickasaw vs Salvadoran Kindergarten

COMPARE

Chickasaw
Race
Ancestry
AfghanAfricanAlaska NativeAlaskan AthabascanAlbanianAleutAlsatianAmericanApacheArabArapahoArgentineanArmenianAssyrian/Chaldean/SyriacAustralianAustrianBahamianBangladeshiBarbadianBasqueBelgianBelizeanBermudanBhutaneseBlackfeetBolivianBrazilianBritishBritish West IndianBulgarianBurmeseCajunCambodianCanadianCape VerdeanCarpatho RusynCelticCentral AmericanCentral American IndianCherokeeCheyenneChickasawChileanChineseChippewaChoctawColombianColvilleComancheCosta RicanCreeCreekCroatianCrowCubanCypriotCzechCzechoslovakianDanishDelawareDominicanDutchDutch West IndianEastern EuropeanEcuadorianEgyptianEnglishEstonianEthiopianEuropeanFijianFilipinoFinnishFrenchFrench American IndianFrench CanadianGermanGerman RussianGhanaianGreekGuamanian/ChamorroGuatemalanGuyaneseHaitianHmongHonduranHopiHoumaHungarianIcelanderIndian (Asian)IndonesianInupiatIranianIraqiIrishIroquoisIsraeliItalianJamaicanJapaneseJordanianKenyanKiowaKoreanLaotianLatvianLebaneseLiberianLithuanianLumbeeLuxembourgerMacedonianMalaysianMalteseMarshalleseMenomineeMexicanMexican American IndianMongolianMoroccanNative HawaiianNavajoNepaleseNew ZealanderNicaraguanNigerianNorthern EuropeanNorwegianOkinawanOsageOttawaPaiutePakistaniPalestinianPanamanianParaguayanPennsylvania GermanPeruvianPimaPolishPortuguesePotawatomiPuebloPuerto RicanPuget Sound SalishRomanianRussianSamoanScandinavianScotch-IrishScottishSeminoleSenegaleseSerbianShoshoneSierra LeoneanSiouxSlavicSlovakSloveneSomaliSouth AfricanSouth AmericanSouth American IndianSoviet UnionSpaniardSpanishSpanish AmericanSpanish American IndianSri LankanSubsaharan AfricanSudaneseSwedishSwissSyrianTaiwaneseThaiTlingit-HaidaTohono O'OdhamTonganTrinidadian and TobagonianTsimshianTurkishU.S. Virgin IslanderUgandanUkrainianUruguayanUteVenezuelanVietnameseWelshWest IndianYakamaYaquiYugoslavianYumanYup'ikZimbabwean
Immigration
NonimmigrantsImmigrantsAfghanistanAfricaAlbaniaArgentinaArmeniaAsiaAustraliaAustriaBahamasBangladeshBarbadosBelarusBelgiumBelizeBoliviaBosnia and HerzegovinaBrazilBulgariaBurma/MyanmarCabo VerdeCambodiaCameroonCanadaCaribbeanCentral AmericaChileChinaColombiaCongoCosta RicaCroatiaCubaCzechoslovakiaDenmarkDominicaDominican RepublicEastern AfricaEastern AsiaEastern EuropeEcuadorEgyptEl SalvadorEnglandEritreaEthiopiaEuropeFijiFranceGermanyGhanaGreeceGrenadaGuatemalaGuyanaHaitiHondurasHong KongHungaryIndiaIndonesiaIranIraqIrelandIsraelItalyJamaicaJapanJordanKazakhstanKenyaKoreaKuwaitLaosLatin AmericaLatviaLebanonLiberiaLithuaniaMalaysiaMexicoMicronesiaMiddle AfricaMoldovaMoroccoNepalNetherlandsNicaraguaNigeriaNorth AmericaNorth MacedoniaNorthern AfricaNorthern EuropeNorwayOceaniaPakistanPanamaPeruPhilippinesPolandPortugalRomaniaRussiaSaudi ArabiaScotlandSenegalSerbiaSierra LeoneSingaporeSomaliaSouth AfricaSouth AmericaSouth Central AsiaSouth Eastern AsiaSouthern EuropeSpainSri LankaSt. Vincent and the GrenadinesSudanSwedenSwitzerlandSyriaTaiwanThailandTrinidad and TobagoTurkeyUgandaUkraineUruguayUzbekistanVenezuelaVietnamWest IndiesWestern AfricaWestern AsiaWestern EuropeYemenZaireZimbabweAzores
Salvadoran
Race
Ancestry
AfghanAfricanAlaska NativeAlaskan AthabascanAlbanianAleutAlsatianAmericanApacheArabArapahoArgentineanArmenianAssyrian/Chaldean/SyriacAustralianAustrianBahamianBangladeshiBarbadianBasqueBelgianBelizeanBermudanBhutaneseBlackfeetBolivianBrazilianBritishBritish West IndianBulgarianBurmeseCajunCambodianCanadianCape VerdeanCarpatho RusynCelticCentral AmericanCentral American IndianCherokeeCheyenneChileanChineseChippewaChoctawColombianColvilleComancheCosta RicanCreeCreekCroatianCrowCubanCypriotCzechCzechoslovakianDanishDelawareDominicanDutchDutch West IndianEastern EuropeanEcuadorianEgyptianEnglishEstonianEthiopianEuropeanFijianFilipinoFinnishFrenchFrench American IndianFrench CanadianGermanGerman RussianGhanaianGreekGuamanian/ChamorroGuatemalanGuyaneseHaitianHmongHonduranHopiHoumaHungarianIcelanderIndian (Asian)IndonesianInupiatIranianIraqiIrishIroquoisIsraeliItalianJamaicanJapaneseJordanianKenyanKiowaKoreanLaotianLatvianLebaneseLiberianLithuanianLumbeeLuxembourgerMacedonianMalaysianMalteseMarshalleseMenomineeMexicanMexican American IndianMongolianMoroccanNative HawaiianNavajoNepaleseNew ZealanderNicaraguanNigerianNorthern EuropeanNorwegianOkinawanOsageOttawaPaiutePakistaniPalestinianPanamanianParaguayanPennsylvania GermanPeruvianPimaPolishPortuguesePotawatomiPuebloPuerto RicanPuget Sound SalishRomanianRussianSalvadoranSamoanScandinavianScotch-IrishScottishSeminoleSenegaleseSerbianShoshoneSierra LeoneanSiouxSlavicSlovakSloveneSomaliSouth AfricanSouth AmericanSouth American IndianSoviet UnionSpaniardSpanishSpanish AmericanSpanish American IndianSri LankanSubsaharan AfricanSudaneseSwedishSwissSyrianTaiwaneseThaiTlingit-HaidaTohono O'OdhamTonganTrinidadian and TobagonianTsimshianTurkishU.S. Virgin IslanderUgandanUkrainianUruguayanUteVenezuelanVietnameseWelshWest IndianYakamaYaquiYugoslavianYumanYup'ikZimbabwean
Immigration
NonimmigrantsImmigrantsAfghanistanAfricaAlbaniaArgentinaArmeniaAsiaAustraliaAustriaBahamasBangladeshBarbadosBelarusBelgiumBelizeBoliviaBosnia and HerzegovinaBrazilBulgariaBurma/MyanmarCabo VerdeCambodiaCameroonCanadaCaribbeanCentral AmericaChileChinaColombiaCongoCosta RicaCroatiaCubaCzechoslovakiaDenmarkDominicaDominican RepublicEastern AfricaEastern AsiaEastern EuropeEcuadorEgyptEl SalvadorEnglandEritreaEthiopiaEuropeFijiFranceGermanyGhanaGreeceGrenadaGuatemalaGuyanaHaitiHondurasHong KongHungaryIndiaIndonesiaIranIraqIrelandIsraelItalyJamaicaJapanJordanKazakhstanKenyaKoreaKuwaitLaosLatin AmericaLatviaLebanonLiberiaLithuaniaMalaysiaMexicoMicronesiaMiddle AfricaMoldovaMoroccoNepalNetherlandsNicaraguaNigeriaNorth AmericaNorth MacedoniaNorthern AfricaNorthern EuropeNorwayOceaniaPakistanPanamaPeruPhilippinesPolandPortugalRomaniaRussiaSaudi ArabiaScotlandSenegalSerbiaSierra LeoneSingaporeSomaliaSouth AfricaSouth AmericaSouth Central AsiaSouth Eastern AsiaSouthern EuropeSpainSri LankaSt. Vincent and the GrenadinesSudanSwedenSwitzerlandSyriaTaiwanThailandTrinidad and TobagoTurkeyUgandaUkraineUruguayUzbekistanVenezuelaVietnamWest IndiesWestern AfricaWestern AsiaWestern EuropeYemenZaireZimbabweAzores
Kindergarten
Income
Poverty
Unemployment
Labor Participation
Family Structure
Vehicle Availability
Education Level
Disability

Kindergarten Comparison

Chickasaw

Salvadorans

Exceptional
Tragic
98.4%
KINDERGARTEN
99.6/ 100
METRIC RATING
71st/ 347
METRIC RANK
96.3%
KINDERGARTEN
0.0/ 100
METRIC RATING
343rd/ 347
METRIC RANK

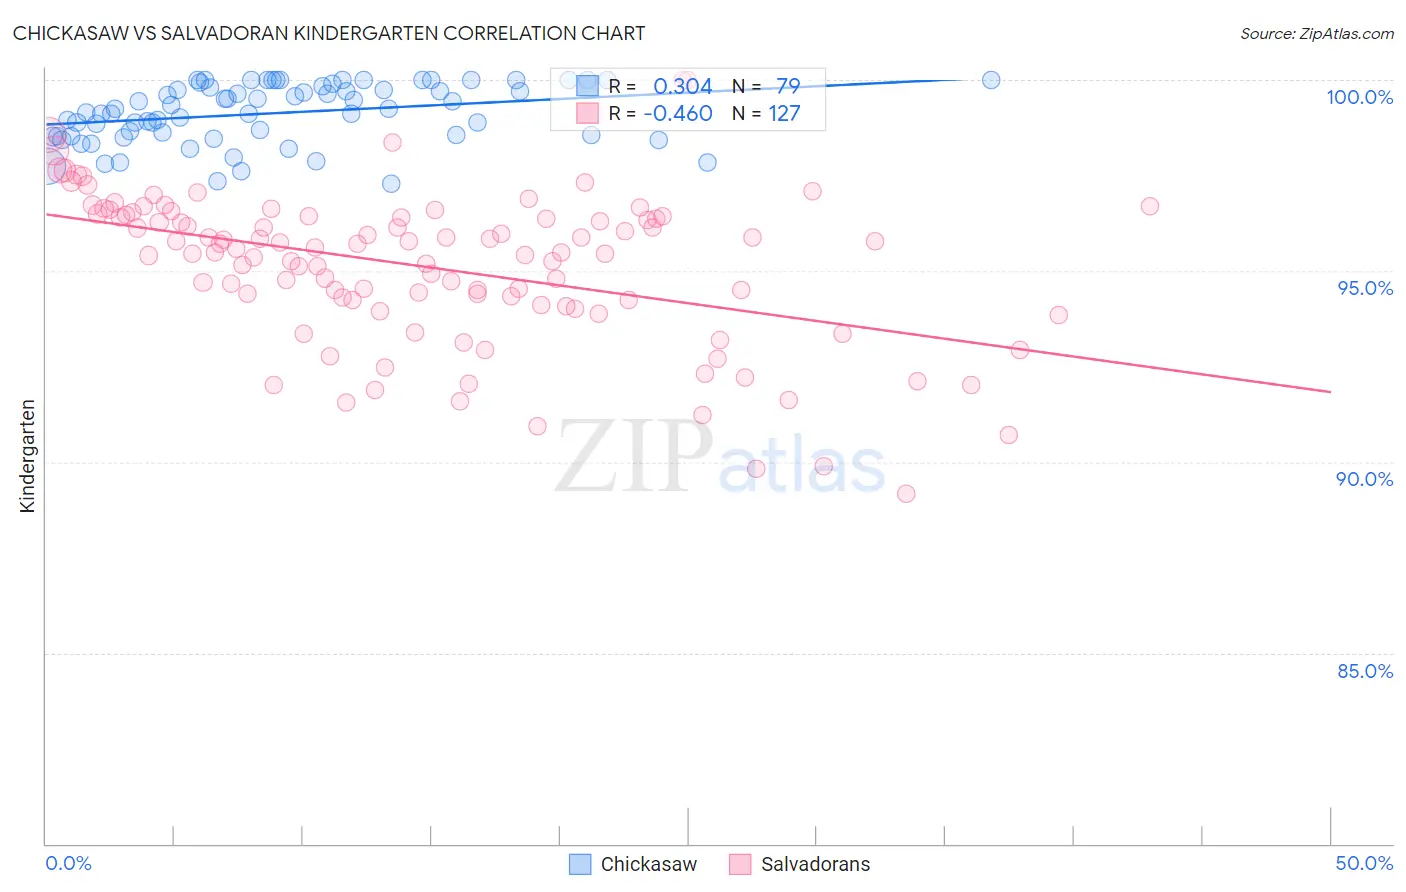
Chickasaw vs Salvadoran Kindergarten Correlation Chart

The statistical analysis conducted on geographies consisting of 147,725,081 people shows a mild positive correlation between the proportion of Chickasaw and percentage of population with at least kindergarten education in the United States with a correlation coefficient (R) of 0.304 and weighted average of 98.4%. Similarly, the statistical analysis conducted on geographies consisting of 398,901,064 people shows a moderate negative correlation between the proportion of Salvadorans and percentage of population with at least kindergarten education in the United States with a correlation coefficient (R) of -0.460 and weighted average of 96.3%, a difference of 2.1%.
Chickasaw vs Salvadoran Kindergarten

Kindergarten Correlation Summary

MeasurementChickasawSalvadoran
Minimum97.3%89.2%
Maximum100.0%100.0%
Range2.7%10.8%
Mean99.1%95.1%
Median99.3%95.5%
Interquartile 25% (IQ1)98.5%94.1%
Interquartile 75% (IQ3)99.8%96.4%
Interquartile Range (IQR)1.3%2.3%
Standard Deviation (Sample)0.76%2.0%
Standard Deviation (Population)0.76%2.0%

Similar Demographics by Kindergarten

Demographics Similar to Chickasaw by Kindergarten

In terms of kindergarten, the demographic groups most similar to Chickasaw are Immigrants from Northern Europe (98.4%, a difference of 0.0%), Immigrants from Austria (98.4%, a difference of 0.0%), Russian (98.4%, a difference of 0.0%), Serbian (98.4%, a difference of 0.0%), and Cheyenne (98.4%, a difference of 0.010%).
DemographicsRating | RankKindergarten
Greeks
99.7
/100
|
#64
Exceptional
98.4%
Maltese
99.7
/100
|
#65
Exceptional
98.4%
Cheyenne
99.6
/100
|
#66
Exceptional
98.4%
Canadians
99.6
/100
|
#67
Exceptional
98.4%
Immigrants | Northern Europe
99.6
/100
|
#68
Exceptional
98.4%
Immigrants | Austria
99.6
/100
|
#69
Exceptional
98.4%
Russians
99.6
/100
|
#70
Exceptional
98.4%
Chickasaw
99.6
/100
|
#71
Exceptional
98.4%
Serbians
99.6
/100
|
#72
Exceptional
98.4%
Cajuns
99.4
/100
|
#73
Exceptional
98.3%
Immigrants | Netherlands
99.3
/100
|
#74
Exceptional
98.3%
Cherokee
99.3
/100
|
#75
Exceptional
98.3%
Immigrants | England
99.3
/100
|
#76
Exceptional
98.3%
Delaware
99.3
/100
|
#77
Exceptional
98.3%
Shoshone
99.2
/100
|
#78
Exceptional
98.3%

Demographics Similar to Salvadorans by Kindergarten

In terms of kindergarten, the demographic groups most similar to Salvadorans are Immigrants from Mexico (96.4%, a difference of 0.030%), Immigrants from Central America (96.4%, a difference of 0.060%), Immigrants from Cabo Verde (96.4%, a difference of 0.060%), Immigrants from Guatemala (96.4%, a difference of 0.10%), and Nepalese (96.2%, a difference of 0.15%).
DemographicsRating | RankKindergarten
Central Americans
0.0
/100
|
#333
Tragic
96.6%
Immigrants | Dominican Republic
0.0
/100
|
#334
Tragic
96.6%
Bangladeshis
0.0
/100
|
#335
Tragic
96.6%
Guatemalans
0.0
/100
|
#336
Tragic
96.5%
Immigrants | Cambodia
0.0
/100
|
#337
Tragic
96.5%
Immigrants | Fiji
0.0
/100
|
#338
Tragic
96.5%
Immigrants | Guatemala
0.0
/100
|
#339
Tragic
96.4%
Immigrants | Central America
0.0
/100
|
#340
Tragic
96.4%
Immigrants | Cabo Verde
0.0
/100
|
#341
Tragic
96.4%
Immigrants | Mexico
0.0
/100
|
#342
Tragic
96.4%
Salvadorans
0.0
/100
|
#343
Tragic
96.3%
Nepalese
0.0
/100
|
#344
Tragic
96.2%
Immigrants | El Salvador
0.0
/100
|
#345
Tragic
96.2%
Immigrants | Yemen
0.0
/100
|
#346
Tragic
95.9%
Spanish American Indians
0.0
/100
|
#347
Tragic
95.8%