Chickasaw vs Immigrants from Haiti 3rd Grade

COMPARE

Chickasaw
Race
Ancestry
AfghanAfricanAlaska NativeAlaskan AthabascanAlbanianAleutAlsatianAmericanApacheArabArapahoArgentineanArmenianAssyrian/Chaldean/SyriacAustralianAustrianBahamianBangladeshiBarbadianBasqueBelgianBelizeanBermudanBhutaneseBlackfeetBolivianBrazilianBritishBritish West IndianBulgarianBurmeseCajunCambodianCanadianCape VerdeanCarpatho RusynCelticCentral AmericanCentral American IndianCherokeeCheyenneChickasawChileanChineseChippewaChoctawColombianColvilleComancheCosta RicanCreeCreekCroatianCrowCubanCypriotCzechCzechoslovakianDanishDelawareDominicanDutchDutch West IndianEastern EuropeanEcuadorianEgyptianEnglishEstonianEthiopianEuropeanFijianFilipinoFinnishFrenchFrench American IndianFrench CanadianGermanGerman RussianGhanaianGreekGuamanian/ChamorroGuatemalanGuyaneseHaitianHmongHonduranHopiHoumaHungarianIcelanderIndian (Asian)IndonesianInupiatIranianIraqiIrishIroquoisIsraeliItalianJamaicanJapaneseJordanianKenyanKiowaKoreanLaotianLatvianLebaneseLiberianLithuanianLumbeeLuxembourgerMacedonianMalaysianMalteseMarshalleseMenomineeMexicanMexican American IndianMongolianMoroccanNative HawaiianNavajoNepaleseNew ZealanderNicaraguanNigerianNorthern EuropeanNorwegianOkinawanOsageOttawaPaiutePakistaniPalestinianPanamanianParaguayanPennsylvania GermanPeruvianPimaPolishPortuguesePotawatomiPuebloPuerto RicanPuget Sound SalishRomanianRussianSalvadoranSamoanScandinavianScotch-IrishScottishSeminoleSenegaleseSerbianShoshoneSierra LeoneanSiouxSlavicSlovakSloveneSomaliSouth AfricanSouth AmericanSouth American IndianSoviet UnionSpaniardSpanishSpanish AmericanSpanish American IndianSri LankanSubsaharan AfricanSudaneseSwedishSwissSyrianTaiwaneseThaiTlingit-HaidaTohono O'OdhamTonganTrinidadian and TobagonianTsimshianTurkishU.S. Virgin IslanderUgandanUkrainianUruguayanUteVenezuelanVietnameseWelshWest IndianYakamaYaquiYugoslavianYumanYup'ikZimbabwean
Immigration
NonimmigrantsImmigrantsAfghanistanAfricaAlbaniaArgentinaArmeniaAsiaAustraliaAustriaBahamasBangladeshBarbadosBelarusBelgiumBelizeBoliviaBosnia and HerzegovinaBrazilBulgariaBurma/MyanmarCabo VerdeCambodiaCameroonCanadaCaribbeanCentral AmericaChileChinaColombiaCongoCosta RicaCroatiaCubaCzechoslovakiaDenmarkDominicaDominican RepublicEastern AfricaEastern AsiaEastern EuropeEcuadorEgyptEl SalvadorEnglandEritreaEthiopiaEuropeFijiFranceGermanyGhanaGreeceGrenadaGuatemalaGuyanaHondurasHong KongHungaryIndiaIndonesiaIranIraqIrelandIsraelItalyJamaicaJapanJordanKazakhstanKenyaKoreaKuwaitLaosLatin AmericaLatviaLebanonLiberiaLithuaniaMalaysiaMexicoMicronesiaMiddle AfricaMoldovaMoroccoNepalNetherlandsNicaraguaNigeriaNorth AmericaNorth MacedoniaNorthern AfricaNorthern EuropeNorwayOceaniaPakistanPanamaPeruPhilippinesPolandPortugalRomaniaRussiaSaudi ArabiaScotlandSenegalSerbiaSierra LeoneSingaporeSomaliaSouth AfricaSouth AmericaSouth Central AsiaSouth Eastern AsiaSouthern EuropeSpainSri LankaSt. Vincent and the GrenadinesSudanSwedenSwitzerlandSyriaTaiwanThailandTrinidad and TobagoTurkeyUgandaUkraineUruguayUzbekistanVenezuelaVietnamWest IndiesWestern AfricaWestern AsiaWestern EuropeYemenZaireZimbabweAzores
Immigrants from Haiti
Race
Ancestry
AfghanAfricanAlaska NativeAlaskan AthabascanAlbanianAleutAlsatianAmericanApacheArabArapahoArgentineanArmenianAssyrian/Chaldean/SyriacAustralianAustrianBahamianBangladeshiBarbadianBasqueBelgianBelizeanBermudanBhutaneseBlackfeetBolivianBrazilianBritishBritish West IndianBulgarianBurmeseCajunCambodianCanadianCape VerdeanCarpatho RusynCelticCentral AmericanCentral American IndianCherokeeCheyenneChileanChineseChippewaChoctawColombianColvilleComancheCosta RicanCreeCreekCroatianCrowCubanCypriotCzechCzechoslovakianDanishDelawareDominicanDutchDutch West IndianEastern EuropeanEcuadorianEgyptianEnglishEstonianEthiopianEuropeanFijianFilipinoFinnishFrenchFrench American IndianFrench CanadianGermanGerman RussianGhanaianGreekGuamanian/ChamorroGuatemalanGuyaneseHaitianHmongHonduranHopiHoumaHungarianIcelanderIndian (Asian)IndonesianInupiatIranianIraqiIrishIroquoisIsraeliItalianJamaicanJapaneseJordanianKenyanKiowaKoreanLaotianLatvianLebaneseLiberianLithuanianLumbeeLuxembourgerMacedonianMalaysianMalteseMarshalleseMenomineeMexicanMexican American IndianMongolianMoroccanNative HawaiianNavajoNepaleseNew ZealanderNicaraguanNigerianNorthern EuropeanNorwegianOkinawanOsageOttawaPaiutePakistaniPalestinianPanamanianParaguayanPennsylvania GermanPeruvianPimaPolishPortuguesePotawatomiPuebloPuerto RicanPuget Sound SalishRomanianRussianSalvadoranSamoanScandinavianScotch-IrishScottishSeminoleSenegaleseSerbianShoshoneSierra LeoneanSiouxSlavicSlovakSloveneSomaliSouth AfricanSouth AmericanSouth American IndianSoviet UnionSpaniardSpanishSpanish AmericanSpanish American IndianSri LankanSubsaharan AfricanSudaneseSwedishSwissSyrianTaiwaneseThaiTlingit-HaidaTohono O'OdhamTonganTrinidadian and TobagonianTsimshianTurkishU.S. Virgin IslanderUgandanUkrainianUruguayanUteVenezuelanVietnameseWelshWest IndianYakamaYaquiYugoslavianYumanYup'ikZimbabwean
Immigration
NonimmigrantsImmigrantsAfghanistanAfricaAlbaniaArgentinaArmeniaAsiaAustraliaAustriaBahamasBangladeshBarbadosBelarusBelgiumBelizeBoliviaBosnia and HerzegovinaBrazilBulgariaBurma/MyanmarCabo VerdeCambodiaCameroonCanadaCaribbeanCentral AmericaChileChinaColombiaCongoCosta RicaCroatiaCubaCzechoslovakiaDenmarkDominicaDominican RepublicEastern AfricaEastern AsiaEastern EuropeEcuadorEgyptEl SalvadorEnglandEritreaEthiopiaEuropeFijiFranceGermanyGhanaGreeceGrenadaGuatemalaGuyanaHaitiHondurasHong KongHungaryIndiaIndonesiaIranIraqIrelandIsraelItalyJamaicaJapanJordanKazakhstanKenyaKoreaKuwaitLaosLatin AmericaLatviaLebanonLiberiaLithuaniaMalaysiaMexicoMicronesiaMiddle AfricaMoldovaMoroccoNepalNetherlandsNicaraguaNigeriaNorth AmericaNorth MacedoniaNorthern AfricaNorthern EuropeNorwayOceaniaPakistanPanamaPeruPhilippinesPolandPortugalRomaniaRussiaSaudi ArabiaScotlandSenegalSerbiaSierra LeoneSingaporeSomaliaSouth AfricaSouth AmericaSouth Central AsiaSouth Eastern AsiaSouthern EuropeSpainSri LankaSt. Vincent and the GrenadinesSudanSwedenSwitzerlandSyriaTaiwanThailandTrinidad and TobagoTurkeyUgandaUkraineUruguayUzbekistanVenezuelaVietnamWest IndiesWestern AfricaWestern AsiaWestern EuropeYemenZaireZimbabweAzores
3rd Grade
Income
Poverty
Unemployment
Labor Participation
Family Structure
Vehicle Availability
Education Level
Disability

3rd Grade Comparison

Chickasaw

Immigrants from Haiti

Exceptional
Tragic
98.2%
3RD GRADE
99.5/ 100
METRIC RATING
72nd/ 347
METRIC RANK
96.7%
3RD GRADE
0.0/ 100
METRIC RATING
308th/ 347
METRIC RANK

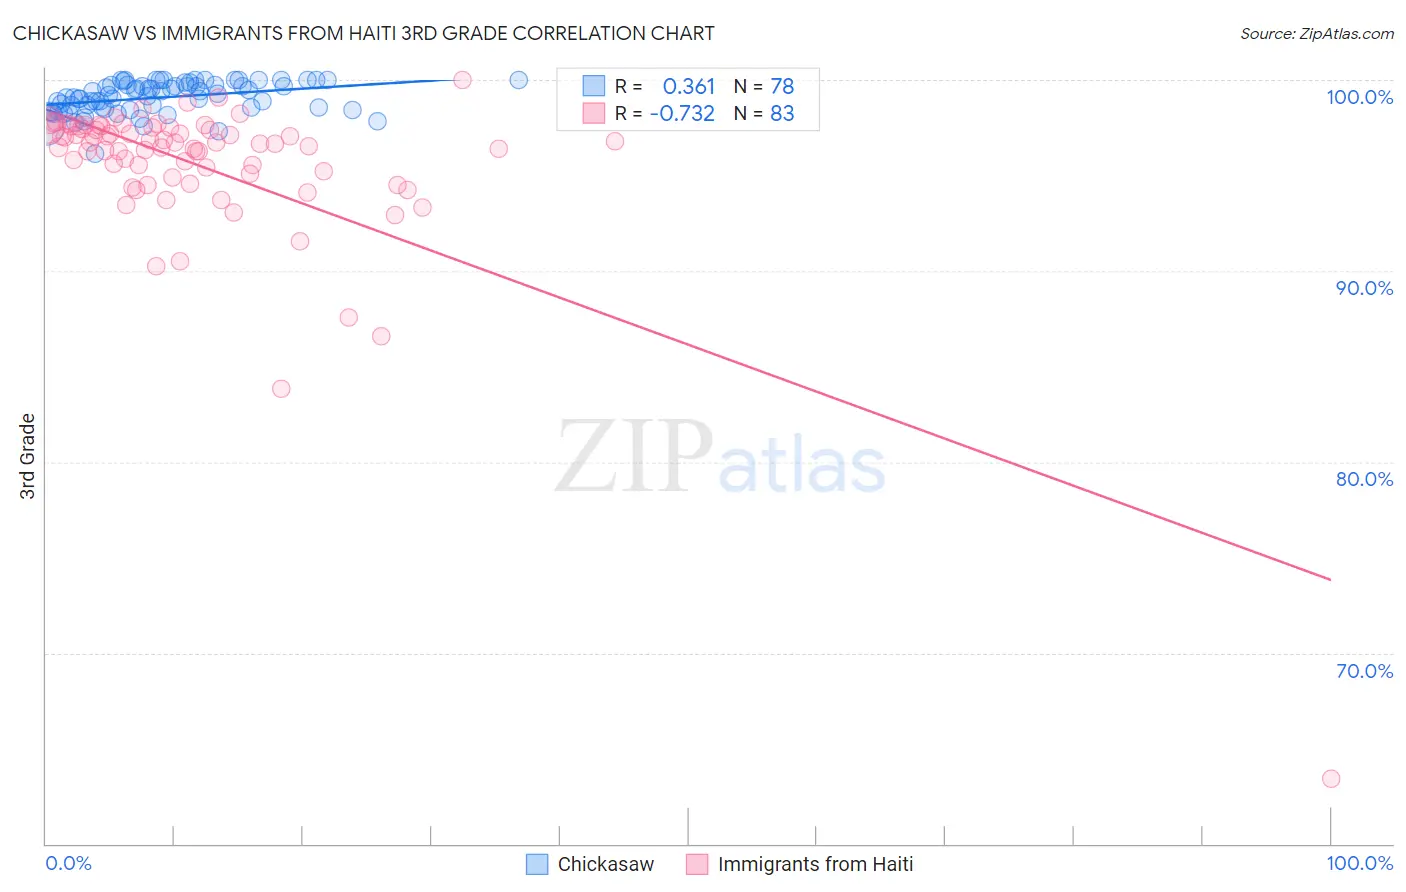
Chickasaw vs Immigrants from Haiti 3rd Grade Correlation Chart

The statistical analysis conducted on geographies consisting of 147,725,311 people shows a mild positive correlation between the proportion of Chickasaw and percentage of population with at least 3rd grade education in the United States with a correlation coefficient (R) of 0.361 and weighted average of 98.2%. Similarly, the statistical analysis conducted on geographies consisting of 225,286,718 people shows a strong negative correlation between the proportion of Immigrants from Haiti and percentage of population with at least 3rd grade education in the United States with a correlation coefficient (R) of -0.732 and weighted average of 96.7%, a difference of 1.6%.
Chickasaw vs Immigrants from Haiti 3rd Grade

3rd Grade Correlation Summary

MeasurementChickasawImmigrants from Haiti
Minimum96.2%63.4%
Maximum100.0%100.0%
Range3.8%36.6%
Mean99.1%95.5%
Median99.2%96.6%
Interquartile 25% (IQ1)98.5%94.9%
Interquartile 75% (IQ3)99.7%97.5%
Interquartile Range (IQR)1.3%2.6%
Standard Deviation (Sample)0.82%4.4%
Standard Deviation (Population)0.81%4.4%

Similar Demographics by 3rd Grade

Demographics Similar to Chickasaw by 3rd Grade

In terms of 3rd grade, the demographic groups most similar to Chickasaw are Immigrants from Austria (98.2%, a difference of 0.0%), Immigrants from Northern Europe (98.2%, a difference of 0.010%), Canadian (98.2%, a difference of 0.010%), Cajun (98.2%, a difference of 0.010%), and New Zealander (98.2%, a difference of 0.020%).
DemographicsRating | Rank3rd Grade
New Zealanders
99.6
/100
|
#65
Exceptional
98.2%
Serbians
99.6
/100
|
#66
Exceptional
98.2%
Russians
99.6
/100
|
#67
Exceptional
98.2%
Immigrants | Northern Europe
99.6
/100
|
#68
Exceptional
98.2%
Canadians
99.6
/100
|
#69
Exceptional
98.2%
Cajuns
99.6
/100
|
#70
Exceptional
98.2%
Immigrants | Austria
99.6
/100
|
#71
Exceptional
98.2%
Chickasaw
99.5
/100
|
#72
Exceptional
98.2%
Cheyenne
99.3
/100
|
#73
Exceptional
98.2%
Immigrants | Netherlands
99.3
/100
|
#74
Exceptional
98.2%
Cherokee
99.3
/100
|
#75
Exceptional
98.2%
Immigrants | England
99.2
/100
|
#76
Exceptional
98.2%
Immigrants | Lithuania
99.2
/100
|
#77
Exceptional
98.2%
Osage
99.2
/100
|
#78
Exceptional
98.2%
Immigrants | Belgium
99.1
/100
|
#79
Exceptional
98.1%

Demographics Similar to Immigrants from Haiti by 3rd Grade

In terms of 3rd grade, the demographic groups most similar to Immigrants from Haiti are Nicaraguan (96.7%, a difference of 0.0%), Sri Lankan (96.7%, a difference of 0.0%), Guyanese (96.7%, a difference of 0.020%), Cape Verdean (96.6%, a difference of 0.030%), and Central American Indian (96.7%, a difference of 0.050%).
DemographicsRating | Rank3rd Grade
Immigrants | Cuba
0.0
/100
|
#301
Tragic
96.8%
Immigrants | Somalia
0.0
/100
|
#302
Tragic
96.8%
Ecuadorians
0.0
/100
|
#303
Tragic
96.7%
Immigrants | Caribbean
0.0
/100
|
#304
Tragic
96.7%
Central American Indians
0.0
/100
|
#305
Tragic
96.7%
Guyanese
0.0
/100
|
#306
Tragic
96.7%
Nicaraguans
0.0
/100
|
#307
Tragic
96.7%
Immigrants | Haiti
0.0
/100
|
#308
Tragic
96.7%
Sri Lankans
0.0
/100
|
#309
Tragic
96.7%
Cape Verdeans
0.0
/100
|
#310
Tragic
96.6%
Immigrants | Guyana
0.0
/100
|
#311
Tragic
96.6%
Immigrants | Laos
0.0
/100
|
#312
Tragic
96.6%
Immigrants | Ecuador
0.0
/100
|
#313
Tragic
96.6%
Belizeans
0.0
/100
|
#314
Tragic
96.6%
Immigrants | Azores
0.0
/100
|
#315
Tragic
96.6%