Chickasaw vs Immigrants from the Azores Doctorate Degree
COMPARE
Chickasaw
Immigrants from the Azores
Doctorate Degree
Doctorate Degree Comparison
Chickasaw
Immigrants from the Azores
1.5%
DOCTORATE DEGREE
0.7/ 100
METRIC RATING
262nd/ 347
METRIC RANK
1.4%
DOCTORATE DEGREE
0.1/ 100
METRIC RATING
315th/ 347
METRIC RANK
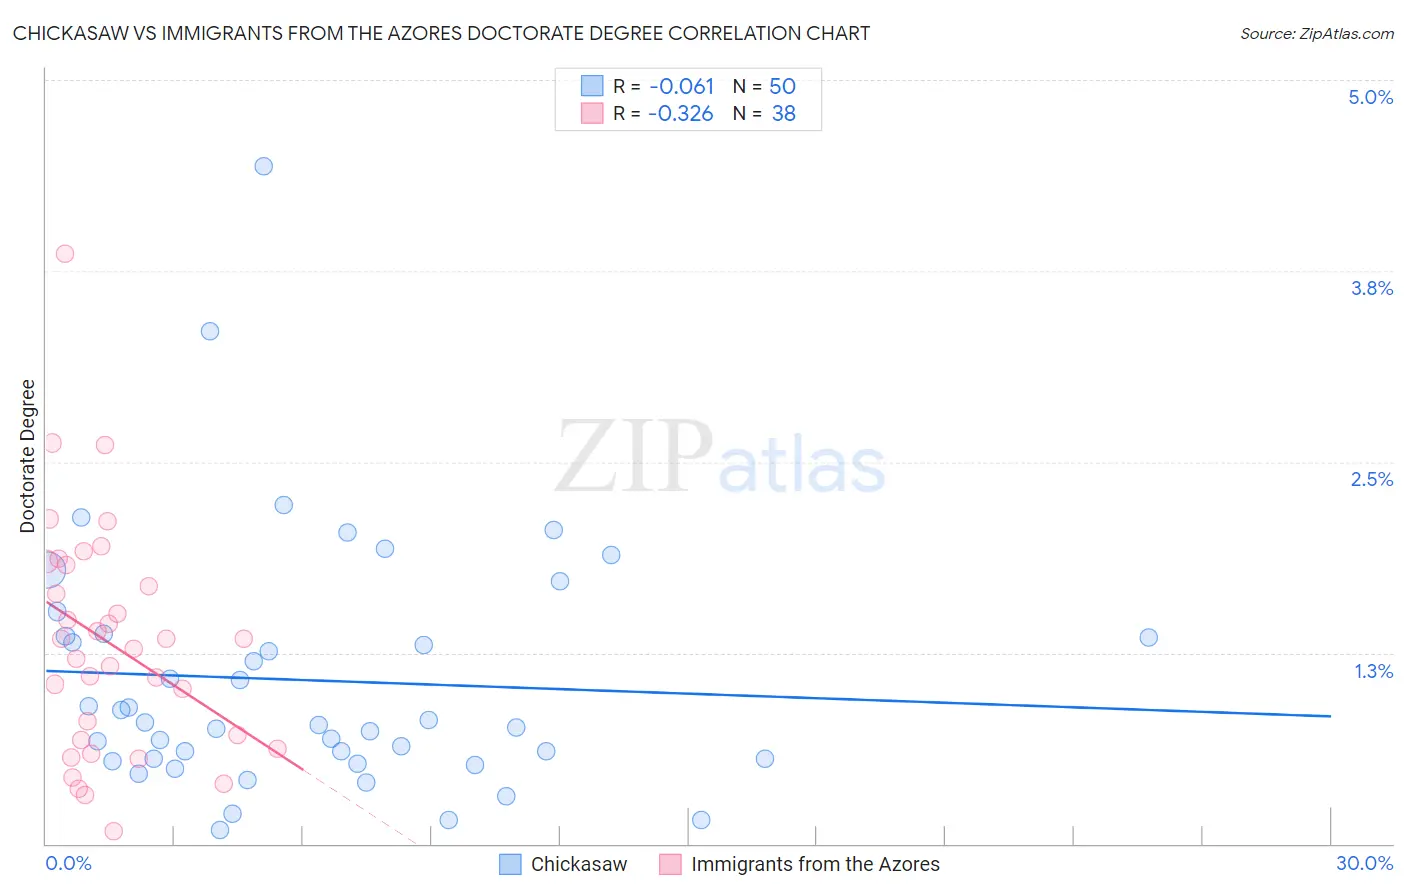
Chickasaw vs Immigrants from the Azores Doctorate Degree Correlation Chart
The statistical analysis conducted on geographies consisting of 146,327,093 people shows a slight negative correlation between the proportion of Chickasaw and percentage of population with at least doctorate degree education in the United States with a correlation coefficient (R) of -0.061 and weighted average of 1.5%. Similarly, the statistical analysis conducted on geographies consisting of 46,011,350 people shows a mild negative correlation between the proportion of Immigrants from the Azores and percentage of population with at least doctorate degree education in the United States with a correlation coefficient (R) of -0.326 and weighted average of 1.4%, a difference of 11.5%.
Doctorate Degree Correlation Summary
| Measurement | Chickasaw | Immigrants from the Azores |
| Minimum | 0.090% | 0.085% |
| Maximum | 4.4% | 3.9% |
| Range | 4.3% | 3.8% |
| Mean | 1.1% | 1.3% |
| Median | 0.79% | 1.3% |
| Interquartile 25% (IQ1) | 0.56% | 0.68% |
| Interquartile 75% (IQ3) | 1.4% | 1.8% |
| Interquartile Range (IQR) | 0.80% | 1.1% |
| Standard Deviation (Sample) | 0.82% | 0.76% |
| Standard Deviation (Population) | 0.81% | 0.75% |
Similar Demographics by Doctorate Degree
Demographics Similar to Chickasaw by Doctorate Degree
In terms of doctorate degree, the demographic groups most similar to Chickasaw are Immigrants from Portugal (1.5%, a difference of 0.15%), Immigrants from Bahamas (1.5%, a difference of 0.17%), Blackfeet (1.5%, a difference of 0.36%), Japanese (1.5%, a difference of 0.61%), and Nicaraguan (1.5%, a difference of 0.64%).
| Demographics | Rating | Rank | Doctorate Degree |
| Trinidadians and Tobagonians | 1.0 /100 | #255 | Tragic 1.5% |
| Central American Indians | 1.0 /100 | #256 | Tragic 1.5% |
| Chippewa | 0.9 /100 | #257 | Tragic 1.5% |
| Immigrants | West Indies | 0.9 /100 | #258 | Tragic 1.5% |
| Liberians | 0.9 /100 | #259 | Tragic 1.5% |
| Japanese | 0.9 /100 | #260 | Tragic 1.5% |
| Immigrants | Portugal | 0.8 /100 | #261 | Tragic 1.5% |
| Chickasaw | 0.7 /100 | #262 | Tragic 1.5% |
| Immigrants | Bahamas | 0.7 /100 | #263 | Tragic 1.5% |
| Blackfeet | 0.7 /100 | #264 | Tragic 1.5% |
| Nicaraguans | 0.6 /100 | #265 | Tragic 1.5% |
| Immigrants | Liberia | 0.5 /100 | #266 | Tragic 1.5% |
| Kiowa | 0.5 /100 | #267 | Tragic 1.5% |
| U.S. Virgin Islanders | 0.5 /100 | #268 | Tragic 1.5% |
| Crow | 0.5 /100 | #269 | Tragic 1.5% |
Demographics Similar to Immigrants from the Azores by Doctorate Degree
In terms of doctorate degree, the demographic groups most similar to Immigrants from the Azores are Dominican (1.4%, a difference of 0.020%), Menominee (1.4%, a difference of 0.10%), Navajo (1.4%, a difference of 0.21%), Immigrants from Nicaragua (1.4%, a difference of 0.42%), and Immigrants from Micronesia (1.3%, a difference of 0.45%).
| Demographics | Rating | Rank | Doctorate Degree |
| Immigrants | Laos | 0.1 /100 | #308 | Tragic 1.4% |
| Immigrants | Grenada | 0.1 /100 | #309 | Tragic 1.4% |
| Immigrants | Jamaica | 0.1 /100 | #310 | Tragic 1.4% |
| Immigrants | Honduras | 0.1 /100 | #311 | Tragic 1.4% |
| Immigrants | Nicaragua | 0.1 /100 | #312 | Tragic 1.4% |
| Menominee | 0.1 /100 | #313 | Tragic 1.4% |
| Dominicans | 0.1 /100 | #314 | Tragic 1.4% |
| Immigrants | Azores | 0.1 /100 | #315 | Tragic 1.4% |
| Navajo | 0.1 /100 | #316 | Tragic 1.4% |
| Immigrants | Micronesia | 0.1 /100 | #317 | Tragic 1.3% |
| Creek | 0.1 /100 | #318 | Tragic 1.3% |
| Immigrants | Guyana | 0.1 /100 | #319 | Tragic 1.3% |
| Immigrants | St. Vincent and the Grenadines | 0.1 /100 | #320 | Tragic 1.3% |
| Dutch West Indians | 0.1 /100 | #321 | Tragic 1.3% |
| Seminole | 0.1 /100 | #322 | Tragic 1.3% |