Cheyenne vs Yakama 7th Grade
COMPARE
Cheyenne
Yakama
7th Grade
7th Grade Comparison
Cheyenne
Yakama
96.5%
7TH GRADE
94.9/ 100
METRIC RATING
121st/ 347
METRIC RANK
91.7%
7TH GRADE
0.0/ 100
METRIC RATING
340th/ 347
METRIC RANK
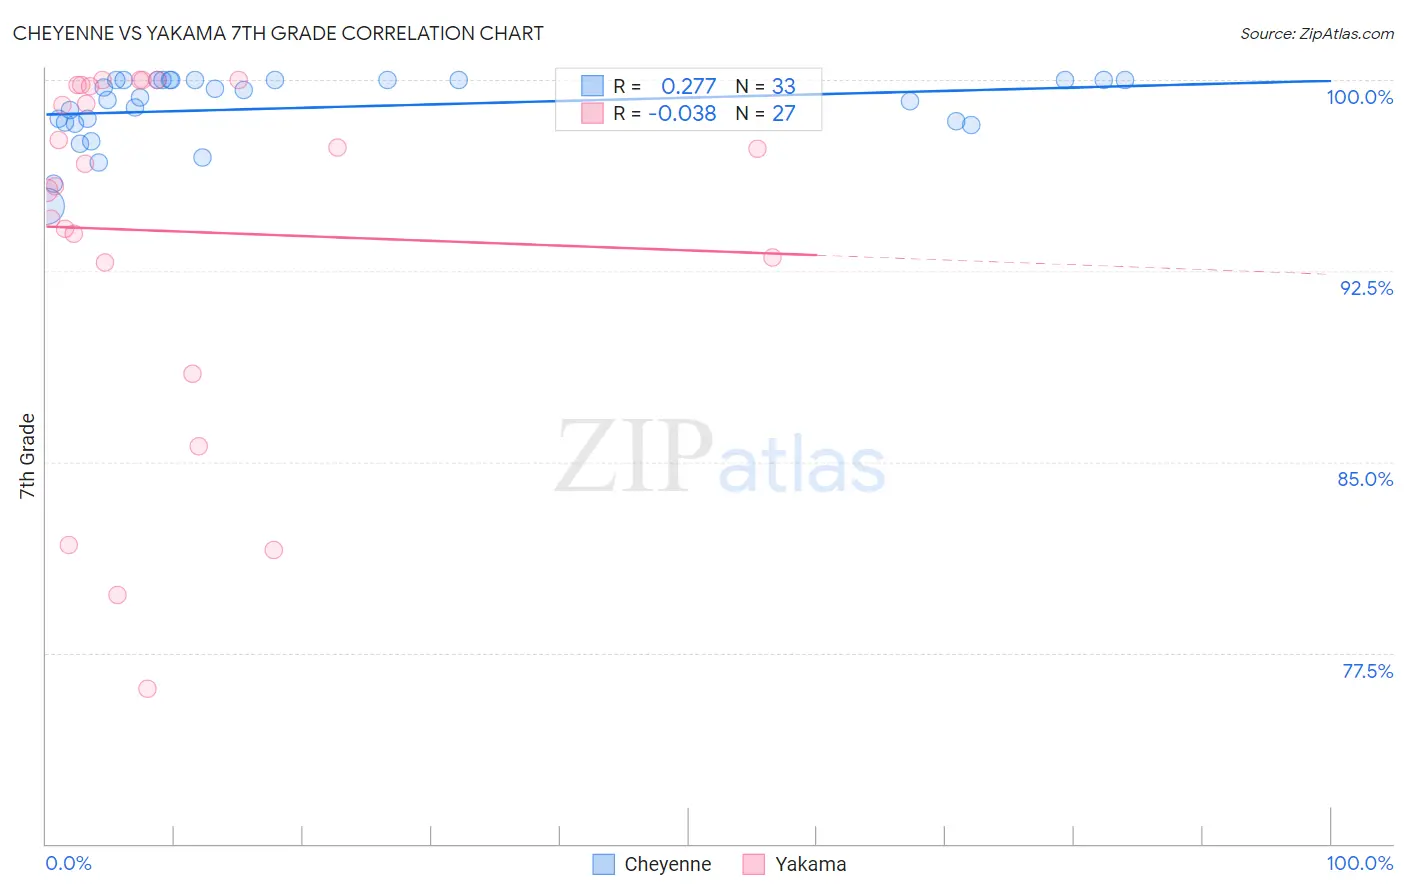
Cheyenne vs Yakama 7th Grade Correlation Chart
The statistical analysis conducted on geographies consisting of 80,716,760 people shows a weak positive correlation between the proportion of Cheyenne and percentage of population with at least 7th grade education in the United States with a correlation coefficient (R) of 0.277 and weighted average of 96.5%. Similarly, the statistical analysis conducted on geographies consisting of 19,923,144 people shows no correlation between the proportion of Yakama and percentage of population with at least 7th grade education in the United States with a correlation coefficient (R) of -0.038 and weighted average of 91.7%, a difference of 5.2%.
7th Grade Correlation Summary
| Measurement | Cheyenne | Yakama |
| Minimum | 95.0% | 76.1% |
| Maximum | 100.0% | 100.0% |
| Range | 5.0% | 23.9% |
| Mean | 98.9% | 94.1% |
| Median | 99.3% | 96.7% |
| Interquartile 25% (IQ1) | 98.3% | 92.8% |
| Interquartile 75% (IQ3) | 100.0% | 99.8% |
| Interquartile Range (IQR) | 1.7% | 6.9% |
| Standard Deviation (Sample) | 1.3% | 7.1% |
| Standard Deviation (Population) | 1.3% | 7.0% |
Similar Demographics by 7th Grade
Demographics Similar to Cheyenne by 7th Grade
In terms of 7th grade, the demographic groups most similar to Cheyenne are Immigrants from Croatia (96.5%, a difference of 0.0%), Immigrants from Europe (96.5%, a difference of 0.0%), Immigrants from Norway (96.5%, a difference of 0.010%), Immigrants from France (96.5%, a difference of 0.010%), and Immigrants from Switzerland (96.5%, a difference of 0.010%).
| Demographics | Rating | Rank | 7th Grade |
| Immigrants | Zimbabwe | 96.6 /100 | #114 | Exceptional 96.5% |
| Choctaw | 96.6 /100 | #115 | Exceptional 96.5% |
| Syrians | 96.6 /100 | #116 | Exceptional 96.5% |
| Immigrants | Moldova | 95.7 /100 | #117 | Exceptional 96.5% |
| Immigrants | Japan | 95.5 /100 | #118 | Exceptional 96.5% |
| Immigrants | Norway | 95.2 /100 | #119 | Exceptional 96.5% |
| Immigrants | Croatia | 95.0 /100 | #120 | Exceptional 96.5% |
| Cheyenne | 94.9 /100 | #121 | Exceptional 96.5% |
| Immigrants | Europe | 94.8 /100 | #122 | Exceptional 96.5% |
| Immigrants | France | 94.7 /100 | #123 | Exceptional 96.5% |
| Immigrants | Switzerland | 94.5 /100 | #124 | Exceptional 96.5% |
| Immigrants | Bulgaria | 94.0 /100 | #125 | Exceptional 96.4% |
| Palestinians | 93.5 /100 | #126 | Exceptional 96.4% |
| Immigrants | Bosnia and Herzegovina | 93.3 /100 | #127 | Exceptional 96.4% |
| Immigrants | Romania | 93.2 /100 | #128 | Exceptional 96.4% |
Demographics Similar to Yakama by 7th Grade
In terms of 7th grade, the demographic groups most similar to Yakama are Guatemalan (91.7%, a difference of 0.020%), Mexican (91.9%, a difference of 0.20%), Salvadoran (91.5%, a difference of 0.29%), Central American (92.1%, a difference of 0.44%), and Immigrants from Guatemala (91.3%, a difference of 0.45%).
| Demographics | Rating | Rank | 7th Grade |
| Immigrants | Armenia | 0.0 /100 | #333 | Tragic 92.7% |
| Immigrants | Yemen | 0.0 /100 | #334 | Tragic 92.6% |
| Mexican American Indians | 0.0 /100 | #335 | Tragic 92.6% |
| Immigrants | Honduras | 0.0 /100 | #336 | Tragic 92.5% |
| Immigrants | Latin America | 0.0 /100 | #337 | Tragic 92.2% |
| Central Americans | 0.0 /100 | #338 | Tragic 92.1% |
| Mexicans | 0.0 /100 | #339 | Tragic 91.9% |
| Yakama | 0.0 /100 | #340 | Tragic 91.7% |
| Guatemalans | 0.0 /100 | #341 | Tragic 91.7% |
| Salvadorans | 0.0 /100 | #342 | Tragic 91.5% |
| Immigrants | Guatemala | 0.0 /100 | #343 | Tragic 91.3% |
| Immigrants | Central America | 0.0 /100 | #344 | Tragic 91.0% |
| Immigrants | El Salvador | 0.0 /100 | #345 | Tragic 90.9% |
| Immigrants | Mexico | 0.0 /100 | #346 | Tragic 90.7% |
| Spanish American Indians | 0.0 /100 | #347 | Tragic 90.3% |