Cheyenne vs Puget Sound Salish 7th Grade
COMPARE
Cheyenne
Puget Sound Salish
7th Grade
7th Grade Comparison
Cheyenne
Puget Sound Salish
96.5%
7TH GRADE
94.9/ 100
METRIC RATING
121st/ 347
METRIC RANK
96.7%
7TH GRADE
99.0/ 100
METRIC RATING
88th/ 347
METRIC RANK
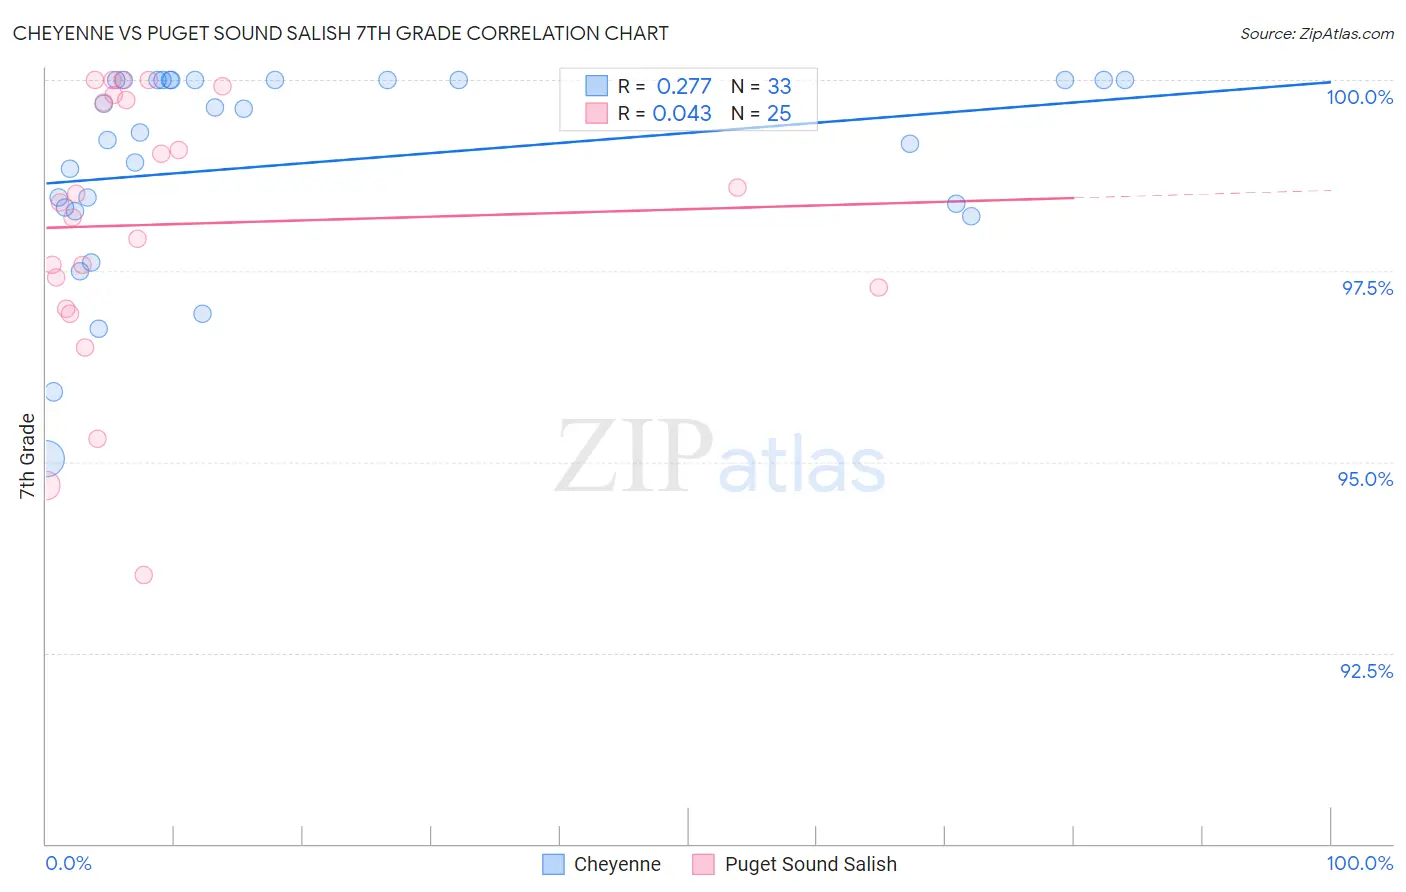
Cheyenne vs Puget Sound Salish 7th Grade Correlation Chart
The statistical analysis conducted on geographies consisting of 80,716,760 people shows a weak positive correlation between the proportion of Cheyenne and percentage of population with at least 7th grade education in the United States with a correlation coefficient (R) of 0.277 and weighted average of 96.5%. Similarly, the statistical analysis conducted on geographies consisting of 46,155,775 people shows no correlation between the proportion of Puget Sound Salish and percentage of population with at least 7th grade education in the United States with a correlation coefficient (R) of 0.043 and weighted average of 96.7%, a difference of 0.26%.
7th Grade Correlation Summary
| Measurement | Cheyenne | Puget Sound Salish |
| Minimum | 95.0% | 93.5% |
| Maximum | 100.0% | 100.0% |
| Range | 5.0% | 6.5% |
| Mean | 98.9% | 98.1% |
| Median | 99.3% | 98.4% |
| Interquartile 25% (IQ1) | 98.3% | 97.1% |
| Interquartile 75% (IQ3) | 100.0% | 99.8% |
| Interquartile Range (IQR) | 1.7% | 2.6% |
| Standard Deviation (Sample) | 1.3% | 1.8% |
| Standard Deviation (Population) | 1.3% | 1.7% |
Similar Demographics by 7th Grade
Demographics Similar to Cheyenne by 7th Grade
In terms of 7th grade, the demographic groups most similar to Cheyenne are Immigrants from Croatia (96.5%, a difference of 0.0%), Immigrants from Europe (96.5%, a difference of 0.0%), Immigrants from Norway (96.5%, a difference of 0.010%), Immigrants from France (96.5%, a difference of 0.010%), and Immigrants from Switzerland (96.5%, a difference of 0.010%).
| Demographics | Rating | Rank | 7th Grade |
| Immigrants | Zimbabwe | 96.6 /100 | #114 | Exceptional 96.5% |
| Choctaw | 96.6 /100 | #115 | Exceptional 96.5% |
| Syrians | 96.6 /100 | #116 | Exceptional 96.5% |
| Immigrants | Moldova | 95.7 /100 | #117 | Exceptional 96.5% |
| Immigrants | Japan | 95.5 /100 | #118 | Exceptional 96.5% |
| Immigrants | Norway | 95.2 /100 | #119 | Exceptional 96.5% |
| Immigrants | Croatia | 95.0 /100 | #120 | Exceptional 96.5% |
| Cheyenne | 94.9 /100 | #121 | Exceptional 96.5% |
| Immigrants | Europe | 94.8 /100 | #122 | Exceptional 96.5% |
| Immigrants | France | 94.7 /100 | #123 | Exceptional 96.5% |
| Immigrants | Switzerland | 94.5 /100 | #124 | Exceptional 96.5% |
| Immigrants | Bulgaria | 94.0 /100 | #125 | Exceptional 96.4% |
| Palestinians | 93.5 /100 | #126 | Exceptional 96.4% |
| Immigrants | Bosnia and Herzegovina | 93.3 /100 | #127 | Exceptional 96.4% |
| Immigrants | Romania | 93.2 /100 | #128 | Exceptional 96.4% |
Demographics Similar to Puget Sound Salish by 7th Grade
In terms of 7th grade, the demographic groups most similar to Puget Sound Salish are Immigrants from Belgium (96.7%, a difference of 0.0%), Cree (96.7%, a difference of 0.0%), Turkish (96.7%, a difference of 0.010%), Immigrants from South Africa (96.7%, a difference of 0.010%), and Osage (96.7%, a difference of 0.010%).
| Demographics | Rating | Rank | 7th Grade |
| Delaware | 99.2 /100 | #81 | Exceptional 96.8% |
| Chickasaw | 99.2 /100 | #82 | Exceptional 96.7% |
| Icelanders | 99.1 /100 | #83 | Exceptional 96.7% |
| Romanians | 99.1 /100 | #84 | Exceptional 96.7% |
| Kiowa | 99.1 /100 | #85 | Exceptional 96.7% |
| Turks | 99.1 /100 | #86 | Exceptional 96.7% |
| Immigrants | Belgium | 99.0 /100 | #87 | Exceptional 96.7% |
| Puget Sound Salish | 99.0 /100 | #88 | Exceptional 96.7% |
| Cree | 99.0 /100 | #89 | Exceptional 96.7% |
| Immigrants | South Africa | 98.9 /100 | #90 | Exceptional 96.7% |
| Osage | 98.9 /100 | #91 | Exceptional 96.7% |
| Immigrants | Western Europe | 98.9 /100 | #92 | Exceptional 96.7% |
| Potawatomi | 98.9 /100 | #93 | Exceptional 96.7% |
| Lebanese | 98.8 /100 | #94 | Exceptional 96.7% |
| Immigrants | Australia | 98.8 /100 | #95 | Exceptional 96.7% |