Cherokee vs Thai No Schooling Completed

COMPARE

Cherokee
Race
Ancestry
AfghanAfricanAlaska NativeAlaskan AthabascanAlbanianAleutAlsatianAmericanApacheArabArapahoArgentineanArmenianAssyrian/Chaldean/SyriacAustralianAustrianBahamianBangladeshiBarbadianBasqueBelgianBelizeanBermudanBhutaneseBlackfeetBolivianBrazilianBritishBritish West IndianBulgarianBurmeseCajunCambodianCanadianCape VerdeanCarpatho RusynCelticCentral AmericanCentral American IndianCherokeeCheyenneChickasawChileanChineseChippewaChoctawColombianColvilleComancheCosta RicanCreeCreekCroatianCrowCubanCypriotCzechCzechoslovakianDanishDelawareDominicanDutchDutch West IndianEastern EuropeanEcuadorianEgyptianEnglishEstonianEthiopianEuropeanFijianFilipinoFinnishFrenchFrench American IndianFrench CanadianGermanGerman RussianGhanaianGreekGuamanian/ChamorroGuatemalanGuyaneseHaitianHmongHonduranHopiHoumaHungarianIcelanderIndian (Asian)IndonesianInupiatIranianIraqiIrishIroquoisIsraeliItalianJamaicanJapaneseJordanianKenyanKiowaKoreanLaotianLatvianLebaneseLiberianLithuanianLumbeeLuxembourgerMacedonianMalaysianMalteseMarshalleseMenomineeMexicanMexican American IndianMongolianMoroccanNative HawaiianNavajoNepaleseNew ZealanderNicaraguanNigerianNorthern EuropeanNorwegianOkinawanOsageOttawaPaiutePakistaniPalestinianPanamanianParaguayanPennsylvania GermanPeruvianPimaPolishPortuguesePotawatomiPuebloPuerto RicanPuget Sound SalishRomanianRussianSalvadoranSamoanScandinavianScotch-IrishScottishSeminoleSenegaleseSerbianShoshoneSierra LeoneanSiouxSlavicSlovakSloveneSomaliSouth AfricanSouth AmericanSouth American IndianSoviet UnionSpaniardSpanishSpanish AmericanSpanish American IndianSri LankanSubsaharan AfricanSudaneseSwedishSwissSyrianTaiwaneseTlingit-HaidaTohono O'OdhamTonganTrinidadian and TobagonianTsimshianTurkishU.S. Virgin IslanderUgandanUkrainianUruguayanUteVenezuelanVietnameseWelshWest IndianYakamaYaquiYugoslavianYumanYup'ikZimbabwean
Immigration
NonimmigrantsImmigrantsAfghanistanAfricaAlbaniaArgentinaArmeniaAsiaAustraliaAustriaBahamasBangladeshBarbadosBelarusBelgiumBelizeBoliviaBosnia and HerzegovinaBrazilBulgariaBurma/MyanmarCabo VerdeCambodiaCameroonCanadaCaribbeanCentral AmericaChileChinaColombiaCongoCosta RicaCroatiaCubaCzechoslovakiaDenmarkDominicaDominican RepublicEastern AfricaEastern AsiaEastern EuropeEcuadorEgyptEl SalvadorEnglandEritreaEthiopiaEuropeFijiFranceGermanyGhanaGreeceGrenadaGuatemalaGuyanaHaitiHondurasHong KongHungaryIndiaIndonesiaIranIraqIrelandIsraelItalyJamaicaJapanJordanKazakhstanKenyaKoreaKuwaitLaosLatin AmericaLatviaLebanonLiberiaLithuaniaMalaysiaMexicoMicronesiaMiddle AfricaMoldovaMoroccoNepalNetherlandsNicaraguaNigeriaNorth AmericaNorth MacedoniaNorthern AfricaNorthern EuropeNorwayOceaniaPakistanPanamaPeruPhilippinesPolandPortugalRomaniaRussiaSaudi ArabiaScotlandSenegalSerbiaSierra LeoneSingaporeSomaliaSouth AfricaSouth AmericaSouth Central AsiaSouth Eastern AsiaSouthern EuropeSpainSri LankaSt. Vincent and the GrenadinesSudanSwedenSwitzerlandSyriaTaiwanThailandTrinidad and TobagoTurkeyUgandaUkraineUruguayUzbekistanVenezuelaVietnamWest IndiesWestern AfricaWestern AsiaWestern EuropeYemenZaireZimbabweAzores
Thai
Race
Ancestry
AfghanAfricanAlaska NativeAlaskan AthabascanAlbanianAleutAlsatianAmericanApacheArabArapahoArgentineanArmenianAssyrian/Chaldean/SyriacAustralianAustrianBahamianBangladeshiBarbadianBasqueBelgianBelizeanBermudanBhutaneseBlackfeetBolivianBrazilianBritishBritish West IndianBulgarianBurmeseCajunCambodianCanadianCape VerdeanCarpatho RusynCelticCentral AmericanCentral American IndianCheyenneChickasawChileanChineseChippewaChoctawColombianColvilleComancheCosta RicanCreeCreekCroatianCrowCubanCypriotCzechCzechoslovakianDanishDelawareDominicanDutchDutch West IndianEastern EuropeanEcuadorianEgyptianEnglishEstonianEthiopianEuropeanFijianFilipinoFinnishFrenchFrench American IndianFrench CanadianGermanGerman RussianGhanaianGreekGuamanian/ChamorroGuatemalanGuyaneseHaitianHmongHonduranHopiHoumaHungarianIcelanderIndian (Asian)IndonesianInupiatIranianIraqiIrishIroquoisIsraeliItalianJamaicanJapaneseJordanianKenyanKiowaKoreanLaotianLatvianLebaneseLiberianLithuanianLumbeeLuxembourgerMacedonianMalaysianMalteseMarshalleseMenomineeMexicanMexican American IndianMongolianMoroccanNative HawaiianNavajoNepaleseNew ZealanderNicaraguanNigerianNorthern EuropeanNorwegianOkinawanOsageOttawaPaiutePakistaniPalestinianPanamanianParaguayanPennsylvania GermanPeruvianPimaPolishPortuguesePotawatomiPuebloPuerto RicanPuget Sound SalishRomanianRussianSalvadoranSamoanScandinavianScotch-IrishScottishSeminoleSenegaleseSerbianShoshoneSierra LeoneanSiouxSlavicSlovakSloveneSomaliSouth AfricanSouth AmericanSouth American IndianSoviet UnionSpaniardSpanishSpanish AmericanSpanish American IndianSri LankanSubsaharan AfricanSudaneseSwedishSwissSyrianTaiwaneseThaiTlingit-HaidaTohono O'OdhamTonganTrinidadian and TobagonianTsimshianTurkishU.S. Virgin IslanderUgandanUkrainianUruguayanUteVenezuelanVietnameseWelshWest IndianYakamaYaquiYugoslavianYumanYup'ikZimbabwean
Immigration
NonimmigrantsImmigrantsAfghanistanAfricaAlbaniaArgentinaArmeniaAsiaAustraliaAustriaBahamasBangladeshBarbadosBelarusBelgiumBelizeBoliviaBosnia and HerzegovinaBrazilBulgariaBurma/MyanmarCabo VerdeCambodiaCameroonCanadaCaribbeanCentral AmericaChileChinaColombiaCongoCosta RicaCroatiaCubaCzechoslovakiaDenmarkDominicaDominican RepublicEastern AfricaEastern AsiaEastern EuropeEcuadorEgyptEl SalvadorEnglandEritreaEthiopiaEuropeFijiFranceGermanyGhanaGreeceGrenadaGuatemalaGuyanaHaitiHondurasHong KongHungaryIndiaIndonesiaIranIraqIrelandIsraelItalyJamaicaJapanJordanKazakhstanKenyaKoreaKuwaitLaosLatin AmericaLatviaLebanonLiberiaLithuaniaMalaysiaMexicoMicronesiaMiddle AfricaMoldovaMoroccoNepalNetherlandsNicaraguaNigeriaNorth AmericaNorth MacedoniaNorthern AfricaNorthern EuropeNorwayOceaniaPakistanPanamaPeruPhilippinesPolandPortugalRomaniaRussiaSaudi ArabiaScotlandSenegalSerbiaSierra LeoneSingaporeSomaliaSouth AfricaSouth AmericaSouth Central AsiaSouth Eastern AsiaSouthern EuropeSpainSri LankaSt. Vincent and the GrenadinesSudanSwedenSwitzerlandSyriaTaiwanThailandTrinidad and TobagoTurkeyUgandaUkraineUruguayUzbekistanVenezuelaVietnamWest IndiesWestern AfricaWestern AsiaWestern EuropeYemenZaireZimbabweAzores
No Schooling Completed
Income
Poverty
Unemployment
Labor Participation
Family Structure
Vehicle Availability
Education Level
Disability

No Schooling Completed Comparison

Cherokee

Thais

Exceptional
Exceptional
1.7%
NO SCHOOLING COMPLETED
99.3/ 100
METRIC RATING
76th/ 347
METRIC RANK
1.8%
NO SCHOOLING COMPLETED
97.5/ 100
METRIC RATING
104th/ 347
METRIC RANK

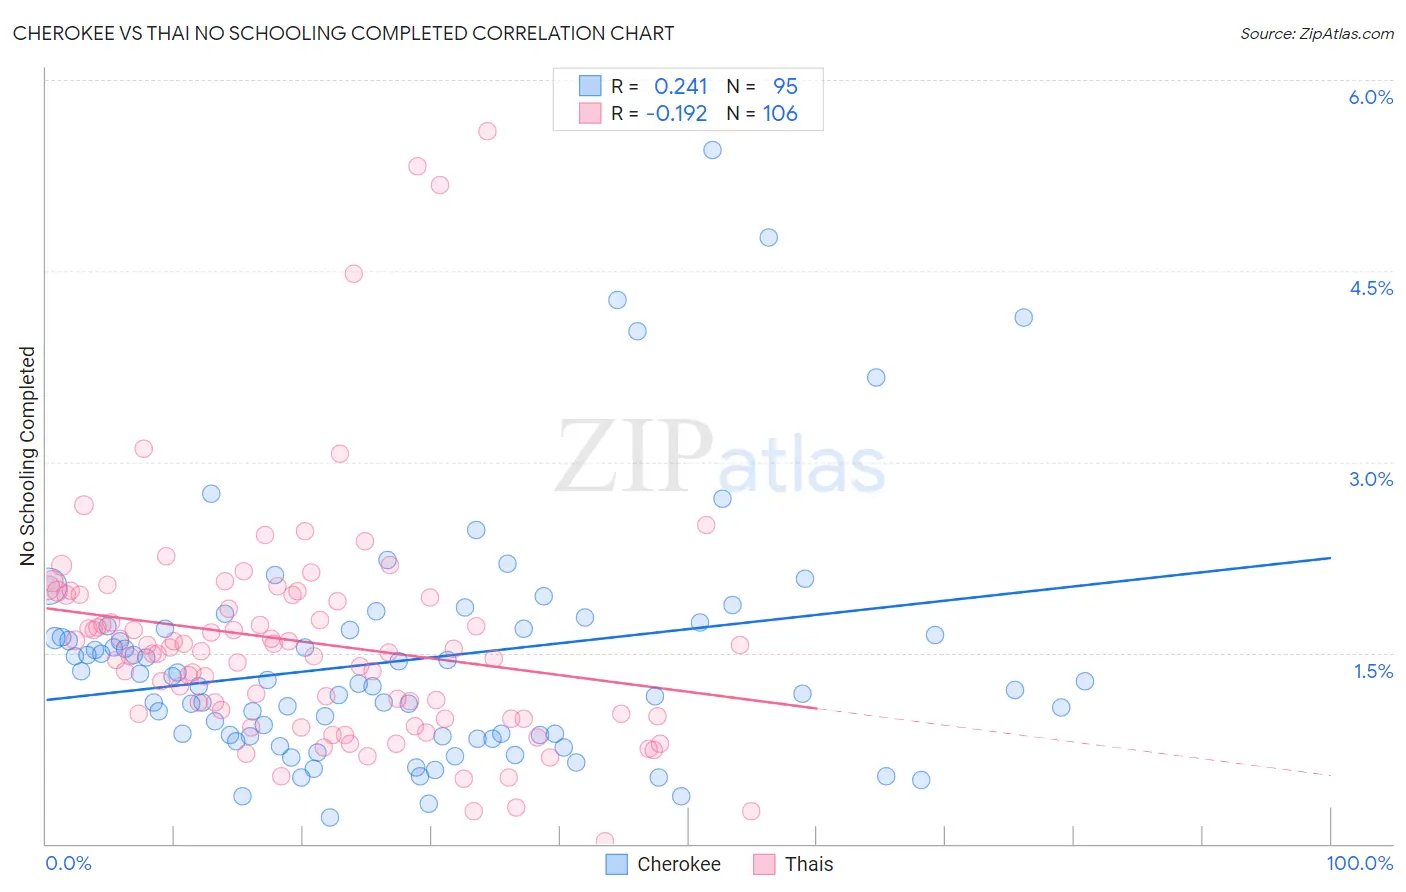
Cherokee vs Thai No Schooling Completed Correlation Chart

The statistical analysis conducted on geographies consisting of 484,763,957 people shows a weak positive correlation between the proportion of Cherokee and percentage of population with no schooling in the United States with a correlation coefficient (R) of 0.241 and weighted average of 1.7%. Similarly, the statistical analysis conducted on geographies consisting of 469,412,663 people shows a poor negative correlation between the proportion of Thais and percentage of population with no schooling in the United States with a correlation coefficient (R) of -0.192 and weighted average of 1.8%, a difference of 5.4%.
Cherokee vs Thai No Schooling Completed

No Schooling Completed Correlation Summary

MeasurementCherokeeThai
Minimum0.21%0.015%
Maximum5.5%5.6%
Range5.2%5.6%
Mean1.4%1.6%
Median1.3%1.5%
Interquartile 25% (IQ1)0.84%1.0%
Interquartile 75% (IQ3)1.7%2.0%
Interquartile Range (IQR)0.85%0.95%
Standard Deviation (Sample)0.94%0.92%
Standard Deviation (Population)0.94%0.92%

Similar Demographics by No Schooling Completed

Demographics Similar to Cherokee by No Schooling Completed

In terms of no schooling completed, the demographic groups most similar to Cherokee are Immigrants from Belgium (1.7%, a difference of 0.040%), Immigrants from Sweden (1.7%, a difference of 0.15%), Delaware (1.7%, a difference of 0.19%), Macedonian (1.7%, a difference of 0.27%), and Cypriot (1.7%, a difference of 0.28%).
DemographicsRating | RankNo Schooling Completed
Chickasaw
99.6
/100
|
#69
Exceptional
1.7%
Immigrants | Netherlands
99.6
/100
|
#70
Exceptional
1.7%
Immigrants | England
99.5
/100
|
#71
Exceptional
1.7%
Cajuns
99.5
/100
|
#72
Exceptional
1.7%
Immigrants | India
99.4
/100
|
#73
Exceptional
1.7%
Zimbabweans
99.4
/100
|
#74
Exceptional
1.7%
Immigrants | Belgium
99.3
/100
|
#75
Exceptional
1.7%
Cherokee
99.3
/100
|
#76
Exceptional
1.7%
Immigrants | Sweden
99.3
/100
|
#77
Exceptional
1.7%
Delaware
99.3
/100
|
#78
Exceptional
1.7%
Macedonians
99.3
/100
|
#79
Exceptional
1.7%
Cypriots
99.3
/100
|
#80
Exceptional
1.7%
Icelanders
99.3
/100
|
#81
Exceptional
1.7%
Immigrants | South Africa
99.3
/100
|
#82
Exceptional
1.7%
Potawatomi
99.3
/100
|
#83
Exceptional
1.7%

Demographics Similar to Thais by No Schooling Completed

In terms of no schooling completed, the demographic groups most similar to Thais are German Russian (1.8%, a difference of 0.020%), Immigrants from France (1.8%, a difference of 0.42%), Yugoslavian (1.8%, a difference of 0.46%), Basque (1.8%, a difference of 0.57%), and Immigrants from Czechoslovakia (1.8%, a difference of 0.63%).
DemographicsRating | RankNo Schooling Completed
Immigrants | Ireland
98.4
/100
|
#97
Exceptional
1.8%
Iranians
98.2
/100
|
#98
Exceptional
1.8%
Choctaw
98.1
/100
|
#99
Exceptional
1.8%
Immigrants | Singapore
98.0
/100
|
#100
Exceptional
1.8%
Immigrants | Czechoslovakia
97.9
/100
|
#101
Exceptional
1.8%
Immigrants | Switzerland
97.9
/100
|
#102
Exceptional
1.8%
Basques
97.9
/100
|
#103
Exceptional
1.8%
Thais
97.5
/100
|
#104
Exceptional
1.8%
German Russians
97.5
/100
|
#105
Exceptional
1.8%
Immigrants | France
97.3
/100
|
#106
Exceptional
1.8%
Yugoslavians
97.2
/100
|
#107
Exceptional
1.8%
Okinawans
97.1
/100
|
#108
Exceptional
1.8%
Immigrants | Saudi Arabia
96.8
/100
|
#109
Exceptional
1.9%
Immigrants | Latvia
96.7
/100
|
#110
Exceptional
1.9%
Immigrants | Japan
96.6
/100
|
#111
Exceptional
1.9%