Cherokee vs Paraguayan Bachelor's Degree
COMPARE
Cherokee
Paraguayan
Bachelor's Degree
Bachelor's Degree Comparison
Cherokee
Paraguayans
30.2%
BACHELOR'S DEGREE
0.0/ 100
METRIC RATING
304th/ 347
METRIC RANK
44.0%
BACHELOR'S DEGREE
99.9/ 100
METRIC RATING
57th/ 347
METRIC RANK
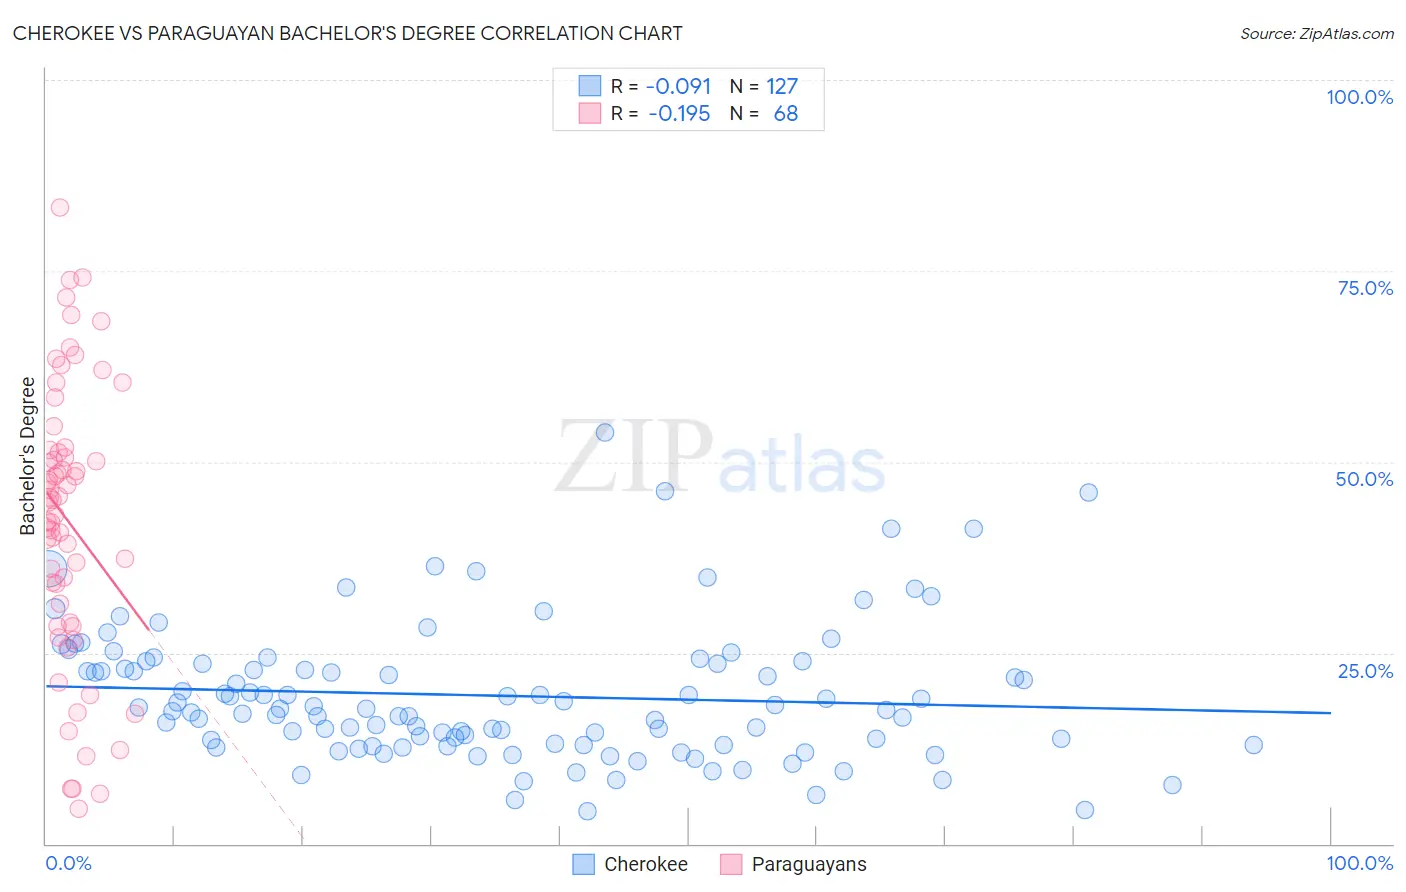
Cherokee vs Paraguayan Bachelor's Degree Correlation Chart
The statistical analysis conducted on geographies consisting of 493,657,197 people shows a slight negative correlation between the proportion of Cherokee and percentage of population with at least bachelor's degree education in the United States with a correlation coefficient (R) of -0.091 and weighted average of 30.2%. Similarly, the statistical analysis conducted on geographies consisting of 95,113,072 people shows a poor negative correlation between the proportion of Paraguayans and percentage of population with at least bachelor's degree education in the United States with a correlation coefficient (R) of -0.195 and weighted average of 44.0%, a difference of 45.9%.
Bachelor's Degree Correlation Summary
| Measurement | Cherokee | Paraguayan |
| Minimum | 4.3% | 4.5% |
| Maximum | 53.8% | 83.2% |
| Range | 49.6% | 78.7% |
| Mean | 19.4% | 42.3% |
| Median | 17.6% | 44.9% |
| Interquartile 25% (IQ1) | 13.0% | 30.2% |
| Interquartile 75% (IQ3) | 23.6% | 51.4% |
| Interquartile Range (IQR) | 10.6% | 21.2% |
| Standard Deviation (Sample) | 8.9% | 18.1% |
| Standard Deviation (Population) | 8.8% | 17.9% |
Similar Demographics by Bachelor's Degree
Demographics Similar to Cherokee by Bachelor's Degree
In terms of bachelor's degree, the demographic groups most similar to Cherokee are Bangladeshi (30.2%, a difference of 0.010%), Mexican American Indian (30.2%, a difference of 0.17%), Immigrants from Latin America (30.1%, a difference of 0.42%), Immigrants from Cuba (30.3%, a difference of 0.45%), and Immigrants from Micronesia (30.4%, a difference of 0.67%).
| Demographics | Rating | Rank | Bachelor's Degree |
| Immigrants | Haiti | 0.0 /100 | #297 | Tragic 30.6% |
| Chippewa | 0.0 /100 | #298 | Tragic 30.6% |
| Chickasaw | 0.0 /100 | #299 | Tragic 30.4% |
| Immigrants | Micronesia | 0.0 /100 | #300 | Tragic 30.4% |
| Immigrants | Cuba | 0.0 /100 | #301 | Tragic 30.3% |
| Mexican American Indians | 0.0 /100 | #302 | Tragic 30.2% |
| Bangladeshis | 0.0 /100 | #303 | Tragic 30.2% |
| Cherokee | 0.0 /100 | #304 | Tragic 30.2% |
| Immigrants | Latin America | 0.0 /100 | #305 | Tragic 30.1% |
| Immigrants | Yemen | 0.0 /100 | #306 | Tragic 29.9% |
| Nepalese | 0.0 /100 | #307 | Tragic 29.9% |
| Cajuns | 0.0 /100 | #308 | Tragic 29.6% |
| Hispanics or Latinos | 0.0 /100 | #309 | Tragic 29.6% |
| Cheyenne | 0.0 /100 | #310 | Tragic 29.4% |
| Choctaw | 0.0 /100 | #311 | Tragic 29.4% |
Demographics Similar to Paraguayans by Bachelor's Degree
In terms of bachelor's degree, the demographic groups most similar to Paraguayans are Immigrants from Czechoslovakia (44.0%, a difference of 0.050%), Australian (44.0%, a difference of 0.16%), New Zealander (44.0%, a difference of 0.16%), Immigrants from Serbia (44.1%, a difference of 0.19%), and Immigrants from Austria (44.2%, a difference of 0.37%).
| Demographics | Rating | Rank | Bachelor's Degree |
| Immigrants | Greece | 99.9 /100 | #50 | Exceptional 44.5% |
| Asians | 99.9 /100 | #51 | Exceptional 44.4% |
| Immigrants | Spain | 99.9 /100 | #52 | Exceptional 44.3% |
| Immigrants | Asia | 99.9 /100 | #53 | Exceptional 44.3% |
| Immigrants | Austria | 99.9 /100 | #54 | Exceptional 44.2% |
| Immigrants | Bolivia | 99.9 /100 | #55 | Exceptional 44.2% |
| Immigrants | Serbia | 99.9 /100 | #56 | Exceptional 44.1% |
| Paraguayans | 99.9 /100 | #57 | Exceptional 44.0% |
| Immigrants | Czechoslovakia | 99.9 /100 | #58 | Exceptional 44.0% |
| Australians | 99.9 /100 | #59 | Exceptional 44.0% |
| New Zealanders | 99.9 /100 | #60 | Exceptional 44.0% |
| South Africans | 99.8 /100 | #61 | Exceptional 43.6% |
| Immigrants | Kazakhstan | 99.8 /100 | #62 | Exceptional 43.4% |
| Immigrants | Europe | 99.8 /100 | #63 | Exceptional 43.4% |
| Argentineans | 99.7 /100 | #64 | Exceptional 43.3% |