Cherokee vs Immigrants from Uganda Bachelor's Degree
COMPARE
Cherokee
Immigrants from Uganda
Bachelor's Degree
Bachelor's Degree Comparison
Cherokee
Immigrants from Uganda
30.2%
BACHELOR'S DEGREE
0.0/ 100
METRIC RATING
304th/ 347
METRIC RANK
40.7%
BACHELOR'S DEGREE
95.7/ 100
METRIC RATING
116th/ 347
METRIC RANK
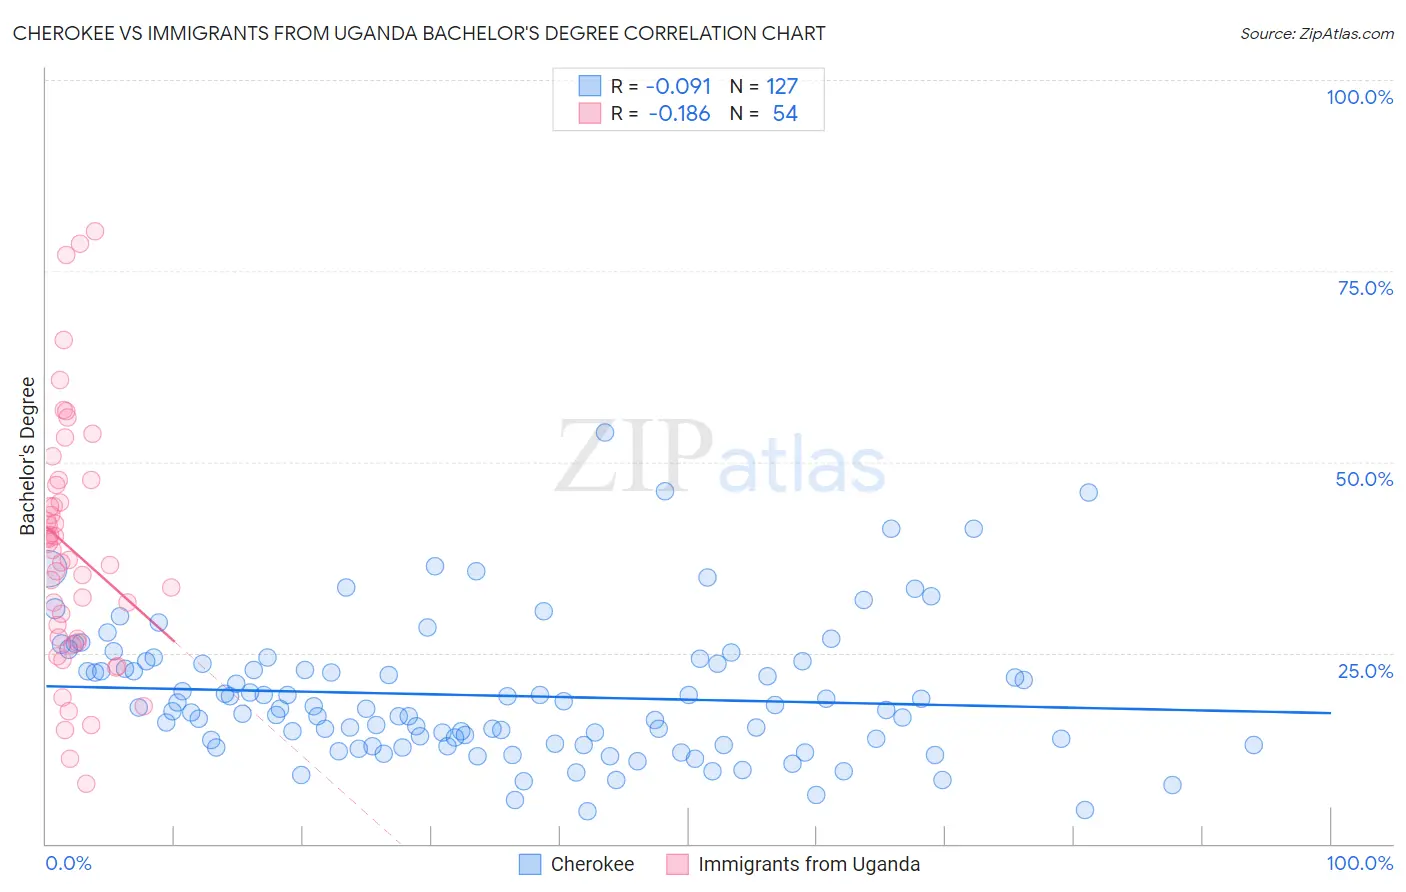
Cherokee vs Immigrants from Uganda Bachelor's Degree Correlation Chart
The statistical analysis conducted on geographies consisting of 493,657,197 people shows a slight negative correlation between the proportion of Cherokee and percentage of population with at least bachelor's degree education in the United States with a correlation coefficient (R) of -0.091 and weighted average of 30.2%. Similarly, the statistical analysis conducted on geographies consisting of 125,980,358 people shows a poor negative correlation between the proportion of Immigrants from Uganda and percentage of population with at least bachelor's degree education in the United States with a correlation coefficient (R) of -0.186 and weighted average of 40.7%, a difference of 34.8%.
Bachelor's Degree Correlation Summary
| Measurement | Cherokee | Immigrants from Uganda |
| Minimum | 4.3% | 7.9% |
| Maximum | 53.8% | 80.2% |
| Range | 49.6% | 72.3% |
| Mean | 19.4% | 38.5% |
| Median | 17.6% | 37.9% |
| Interquartile 25% (IQ1) | 13.0% | 26.9% |
| Interquartile 75% (IQ3) | 23.6% | 47.0% |
| Interquartile Range (IQR) | 10.6% | 20.2% |
| Standard Deviation (Sample) | 8.9% | 16.2% |
| Standard Deviation (Population) | 8.8% | 16.0% |
Similar Demographics by Bachelor's Degree
Demographics Similar to Cherokee by Bachelor's Degree
In terms of bachelor's degree, the demographic groups most similar to Cherokee are Bangladeshi (30.2%, a difference of 0.010%), Mexican American Indian (30.2%, a difference of 0.17%), Immigrants from Latin America (30.1%, a difference of 0.42%), Immigrants from Cuba (30.3%, a difference of 0.45%), and Immigrants from Micronesia (30.4%, a difference of 0.67%).
| Demographics | Rating | Rank | Bachelor's Degree |
| Immigrants | Haiti | 0.0 /100 | #297 | Tragic 30.6% |
| Chippewa | 0.0 /100 | #298 | Tragic 30.6% |
| Chickasaw | 0.0 /100 | #299 | Tragic 30.4% |
| Immigrants | Micronesia | 0.0 /100 | #300 | Tragic 30.4% |
| Immigrants | Cuba | 0.0 /100 | #301 | Tragic 30.3% |
| Mexican American Indians | 0.0 /100 | #302 | Tragic 30.2% |
| Bangladeshis | 0.0 /100 | #303 | Tragic 30.2% |
| Cherokee | 0.0 /100 | #304 | Tragic 30.2% |
| Immigrants | Latin America | 0.0 /100 | #305 | Tragic 30.1% |
| Immigrants | Yemen | 0.0 /100 | #306 | Tragic 29.9% |
| Nepalese | 0.0 /100 | #307 | Tragic 29.9% |
| Cajuns | 0.0 /100 | #308 | Tragic 29.6% |
| Hispanics or Latinos | 0.0 /100 | #309 | Tragic 29.6% |
| Cheyenne | 0.0 /100 | #310 | Tragic 29.4% |
| Choctaw | 0.0 /100 | #311 | Tragic 29.4% |
Demographics Similar to Immigrants from Uganda by Bachelor's Degree
In terms of bachelor's degree, the demographic groups most similar to Immigrants from Uganda are Palestinian (40.7%, a difference of 0.050%), Austrian (40.6%, a difference of 0.10%), Croatian (40.6%, a difference of 0.12%), Afghan (40.8%, a difference of 0.29%), and Brazilian (40.8%, a difference of 0.32%).
| Demographics | Rating | Rank | Bachelor's Degree |
| Arabs | 96.6 /100 | #109 | Exceptional 40.9% |
| Albanians | 96.5 /100 | #110 | Exceptional 40.9% |
| Immigrants | Chile | 96.4 /100 | #111 | Exceptional 40.8% |
| Ugandans | 96.3 /100 | #112 | Exceptional 40.8% |
| Brazilians | 96.3 /100 | #113 | Exceptional 40.8% |
| Afghans | 96.2 /100 | #114 | Exceptional 40.8% |
| Palestinians | 95.8 /100 | #115 | Exceptional 40.7% |
| Immigrants | Uganda | 95.7 /100 | #116 | Exceptional 40.7% |
| Austrians | 95.5 /100 | #117 | Exceptional 40.6% |
| Croatians | 95.5 /100 | #118 | Exceptional 40.6% |
| Immigrants | Syria | 94.9 /100 | #119 | Exceptional 40.5% |
| Venezuelans | 94.7 /100 | #120 | Exceptional 40.5% |
| Moroccans | 94.6 /100 | #121 | Exceptional 40.5% |
| Immigrants | Albania | 94.4 /100 | #122 | Exceptional 40.4% |
| Lebanese | 94.3 /100 | #123 | Exceptional 40.4% |