Canadian vs Spaniard Associate's Degree
COMPARE
Canadian
Spaniard
Associate's Degree
Associate's Degree Comparison
Canadians
Spaniards
47.5%
ASSOCIATE'S DEGREE
79.0/ 100
METRIC RATING
145th/ 347
METRIC RANK
45.2%
ASSOCIATE'S DEGREE
20.4/ 100
METRIC RATING
202nd/ 347
METRIC RANK
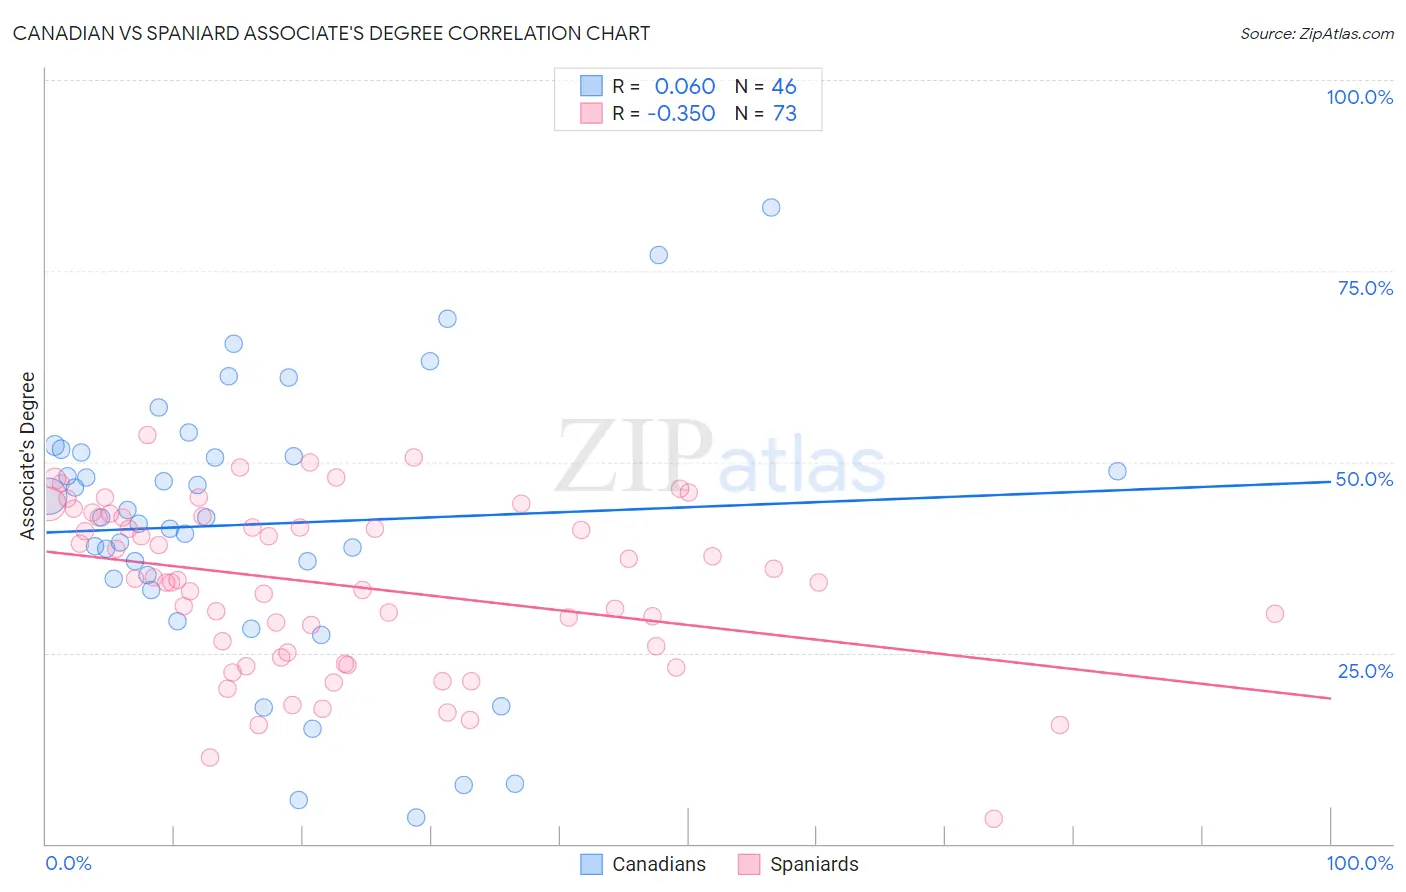
Canadian vs Spaniard Associate's Degree Correlation Chart
The statistical analysis conducted on geographies consisting of 437,535,848 people shows a slight positive correlation between the proportion of Canadians and percentage of population with at least associate's degree education in the United States with a correlation coefficient (R) of 0.060 and weighted average of 47.5%. Similarly, the statistical analysis conducted on geographies consisting of 443,508,579 people shows a mild negative correlation between the proportion of Spaniards and percentage of population with at least associate's degree education in the United States with a correlation coefficient (R) of -0.350 and weighted average of 45.2%, a difference of 5.1%.
Associate's Degree Correlation Summary
| Measurement | Canadian | Spaniard |
| Minimum | 3.4% | 3.3% |
| Maximum | 83.3% | 53.6% |
| Range | 80.0% | 50.2% |
| Mean | 41.8% | 33.8% |
| Median | 42.7% | 34.5% |
| Interquartile 25% (IQ1) | 34.7% | 24.7% |
| Interquartile 75% (IQ3) | 51.3% | 42.8% |
| Interquartile Range (IQR) | 16.6% | 18.1% |
| Standard Deviation (Sample) | 17.8% | 10.9% |
| Standard Deviation (Population) | 17.6% | 10.8% |
Similar Demographics by Associate's Degree
Demographics Similar to Canadians by Associate's Degree
In terms of associate's degree, the demographic groups most similar to Canadians are Immigrants from Sudan (47.4%, a difference of 0.13%), Slavic (47.6%, a difference of 0.17%), Danish (47.4%, a difference of 0.18%), Norwegian (47.6%, a difference of 0.23%), and South American Indian (47.4%, a difference of 0.24%).
| Demographics | Rating | Rank | Associate's Degree |
| Poles | 87.3 /100 | #138 | Excellent 48.0% |
| Slovenes | 85.1 /100 | #139 | Excellent 47.9% |
| Immigrants | Southern Europe | 84.4 /100 | #140 | Excellent 47.8% |
| Taiwanese | 83.3 /100 | #141 | Excellent 47.7% |
| Sierra Leoneans | 82.9 /100 | #142 | Excellent 47.7% |
| Norwegians | 81.0 /100 | #143 | Excellent 47.6% |
| Slavs | 80.5 /100 | #144 | Excellent 47.6% |
| Canadians | 79.0 /100 | #145 | Good 47.5% |
| Immigrants | Sudan | 77.9 /100 | #146 | Good 47.4% |
| Danes | 77.3 /100 | #147 | Good 47.4% |
| South American Indians | 76.7 /100 | #148 | Good 47.4% |
| Immigrants | Armenia | 76.6 /100 | #149 | Good 47.4% |
| Iraqis | 76.2 /100 | #150 | Good 47.4% |
| Immigrants | North Macedonia | 76.0 /100 | #151 | Good 47.4% |
| Immigrants | Afghanistan | 74.3 /100 | #152 | Good 47.3% |
Demographics Similar to Spaniards by Associate's Degree
In terms of associate's degree, the demographic groups most similar to Spaniards are Immigrants from South Eastern Asia (45.2%, a difference of 0.020%), Immigrants from Vietnam (45.2%, a difference of 0.050%), Senegalese (45.2%, a difference of 0.080%), Immigrants from Senegal (45.2%, a difference of 0.090%), and Immigrants from Bangladesh (45.2%, a difference of 0.11%).
| Demographics | Rating | Rank | Associate's Degree |
| Germans | 26.5 /100 | #195 | Fair 45.5% |
| French | 25.6 /100 | #196 | Fair 45.4% |
| Scotch-Irish | 22.3 /100 | #197 | Fair 45.3% |
| Immigrants | Bangladesh | 21.3 /100 | #198 | Fair 45.2% |
| Immigrants | Senegal | 21.2 /100 | #199 | Fair 45.2% |
| Senegalese | 21.1 /100 | #200 | Fair 45.2% |
| Immigrants | Vietnam | 20.8 /100 | #201 | Fair 45.2% |
| Spaniards | 20.4 /100 | #202 | Fair 45.2% |
| Immigrants | South Eastern Asia | 20.2 /100 | #203 | Fair 45.2% |
| Nigerians | 19.1 /100 | #204 | Poor 45.1% |
| Immigrants | Thailand | 18.9 /100 | #205 | Poor 45.1% |
| German Russians | 18.9 /100 | #206 | Poor 45.1% |
| Panamanians | 18.4 /100 | #207 | Poor 45.1% |
| Dutch | 17.6 /100 | #208 | Poor 45.0% |
| Immigrants | Costa Rica | 16.7 /100 | #209 | Poor 45.0% |