Canadian vs Immigrants from Bosnia and Herzegovina Associate's Degree
COMPARE
Canadian
Immigrants from Bosnia and Herzegovina
Associate's Degree
Associate's Degree Comparison
Canadians
Immigrants from Bosnia and Herzegovina
47.5%
ASSOCIATE'S DEGREE
79.0/ 100
METRIC RATING
145th/ 347
METRIC RANK
46.3%
ASSOCIATE'S DEGREE
48.3/ 100
METRIC RATING
178th/ 347
METRIC RANK
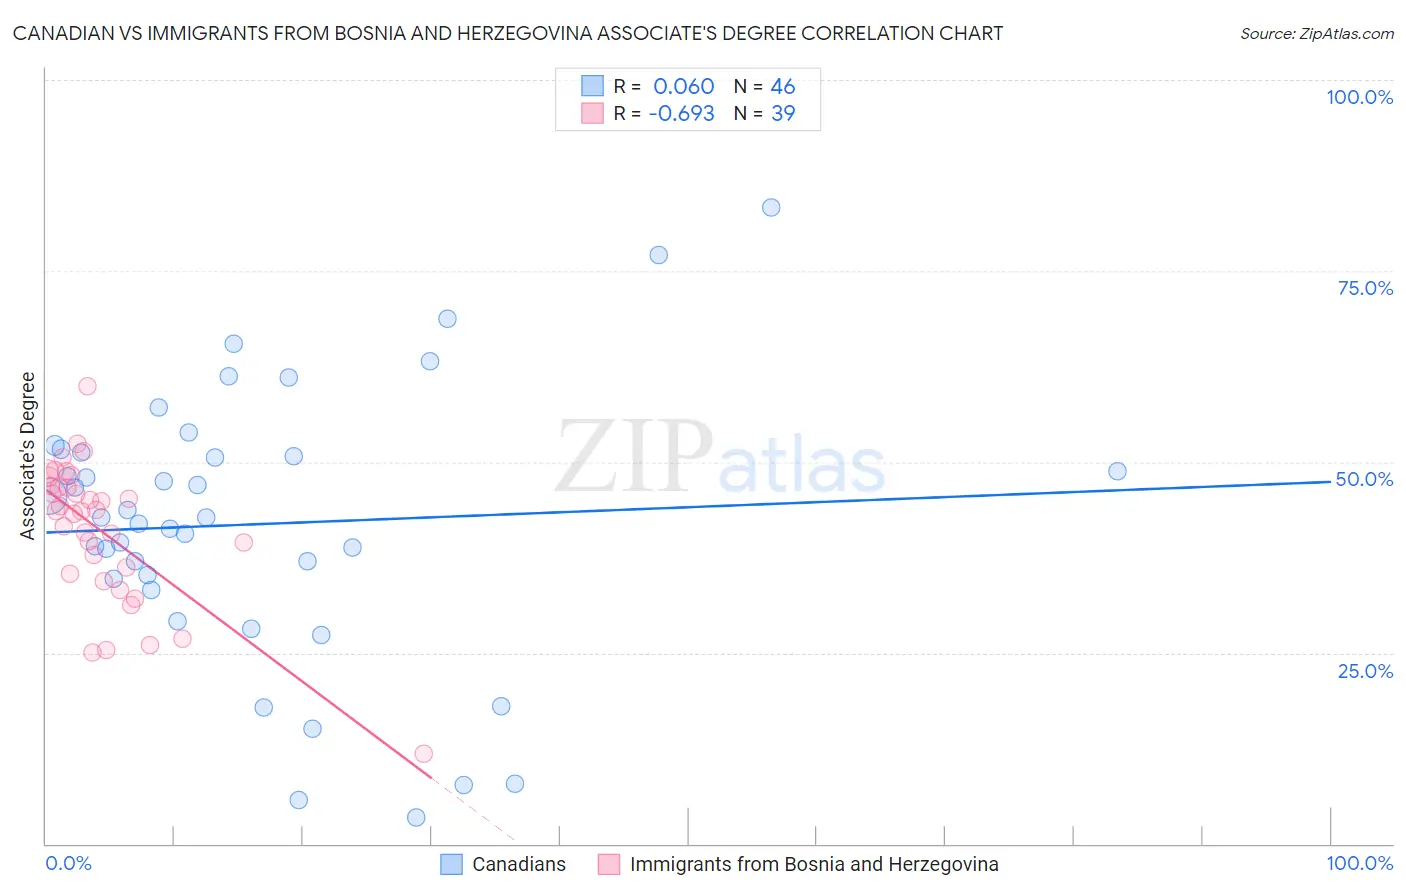
Canadian vs Immigrants from Bosnia and Herzegovina Associate's Degree Correlation Chart
The statistical analysis conducted on geographies consisting of 437,535,848 people shows a slight positive correlation between the proportion of Canadians and percentage of population with at least associate's degree education in the United States with a correlation coefficient (R) of 0.060 and weighted average of 47.5%. Similarly, the statistical analysis conducted on geographies consisting of 156,817,312 people shows a significant negative correlation between the proportion of Immigrants from Bosnia and Herzegovina and percentage of population with at least associate's degree education in the United States with a correlation coefficient (R) of -0.693 and weighted average of 46.3%, a difference of 2.6%.
Associate's Degree Correlation Summary
| Measurement | Canadian | Immigrants from Bosnia and Herzegovina |
| Minimum | 3.4% | 11.8% |
| Maximum | 83.3% | 59.9% |
| Range | 80.0% | 48.2% |
| Mean | 41.8% | 41.0% |
| Median | 42.7% | 43.6% |
| Interquartile 25% (IQ1) | 34.7% | 35.3% |
| Interquartile 75% (IQ3) | 51.3% | 46.9% |
| Interquartile Range (IQR) | 16.6% | 11.5% |
| Standard Deviation (Sample) | 17.8% | 9.4% |
| Standard Deviation (Population) | 17.6% | 9.2% |
Similar Demographics by Associate's Degree
Demographics Similar to Canadians by Associate's Degree
In terms of associate's degree, the demographic groups most similar to Canadians are Immigrants from Sudan (47.4%, a difference of 0.13%), Slavic (47.6%, a difference of 0.17%), Danish (47.4%, a difference of 0.18%), Norwegian (47.6%, a difference of 0.23%), and South American Indian (47.4%, a difference of 0.24%).
| Demographics | Rating | Rank | Associate's Degree |
| Poles | 87.3 /100 | #138 | Excellent 48.0% |
| Slovenes | 85.1 /100 | #139 | Excellent 47.9% |
| Immigrants | Southern Europe | 84.4 /100 | #140 | Excellent 47.8% |
| Taiwanese | 83.3 /100 | #141 | Excellent 47.7% |
| Sierra Leoneans | 82.9 /100 | #142 | Excellent 47.7% |
| Norwegians | 81.0 /100 | #143 | Excellent 47.6% |
| Slavs | 80.5 /100 | #144 | Excellent 47.6% |
| Canadians | 79.0 /100 | #145 | Good 47.5% |
| Immigrants | Sudan | 77.9 /100 | #146 | Good 47.4% |
| Danes | 77.3 /100 | #147 | Good 47.4% |
| South American Indians | 76.7 /100 | #148 | Good 47.4% |
| Immigrants | Armenia | 76.6 /100 | #149 | Good 47.4% |
| Iraqis | 76.2 /100 | #150 | Good 47.4% |
| Immigrants | North Macedonia | 76.0 /100 | #151 | Good 47.4% |
| Immigrants | Afghanistan | 74.3 /100 | #152 | Good 47.3% |
Demographics Similar to Immigrants from Bosnia and Herzegovina by Associate's Degree
In terms of associate's degree, the demographic groups most similar to Immigrants from Bosnia and Herzegovina are Slovak (46.3%, a difference of 0.010%), Finnish (46.3%, a difference of 0.020%), Belgian (46.3%, a difference of 0.040%), Sri Lankan (46.3%, a difference of 0.050%), and English (46.4%, a difference of 0.13%).
| Demographics | Rating | Rank | Associate's Degree |
| Basques | 52.8 /100 | #171 | Average 46.5% |
| Peruvians | 50.5 /100 | #172 | Average 46.4% |
| Immigrants | Iraq | 50.3 /100 | #173 | Average 46.4% |
| English | 50.0 /100 | #174 | Average 46.4% |
| Belgians | 48.9 /100 | #175 | Average 46.3% |
| Finns | 48.5 /100 | #176 | Average 46.3% |
| Slovaks | 48.4 /100 | #177 | Average 46.3% |
| Immigrants | Bosnia and Herzegovina | 48.3 /100 | #178 | Average 46.3% |
| Sri Lankans | 47.6 /100 | #179 | Average 46.3% |
| Bermudans | 46.4 /100 | #180 | Average 46.2% |
| Immigrants | Colombia | 41.3 /100 | #181 | Average 46.0% |
| Swiss | 40.4 /100 | #182 | Average 46.0% |
| Yugoslavians | 40.2 /100 | #183 | Average 46.0% |
| Czechoslovakians | 40.0 /100 | #184 | Average 46.0% |
| Costa Ricans | 38.6 /100 | #185 | Fair 46.0% |