Cajun vs Immigrants from Ukraine 4th Grade

COMPARE

Cajun
Race
Ancestry
AfghanAfricanAlaska NativeAlaskan AthabascanAlbanianAleutAlsatianAmericanApacheArabArapahoArgentineanArmenianAssyrian/Chaldean/SyriacAustralianAustrianBahamianBangladeshiBarbadianBasqueBelgianBelizeanBermudanBhutaneseBlackfeetBolivianBrazilianBritishBritish West IndianBulgarianBurmeseCajunCambodianCanadianCape VerdeanCarpatho RusynCelticCentral AmericanCentral American IndianCherokeeCheyenneChickasawChileanChineseChippewaChoctawColombianColvilleComancheCosta RicanCreeCreekCroatianCrowCubanCypriotCzechCzechoslovakianDanishDelawareDominicanDutchDutch West IndianEastern EuropeanEcuadorianEgyptianEnglishEstonianEthiopianEuropeanFijianFilipinoFinnishFrenchFrench American IndianFrench CanadianGermanGerman RussianGhanaianGreekGuamanian/ChamorroGuatemalanGuyaneseHaitianHmongHonduranHopiHoumaHungarianIcelanderIndian (Asian)IndonesianInupiatIranianIraqiIrishIroquoisIsraeliItalianJamaicanJapaneseJordanianKenyanKiowaKoreanLaotianLatvianLebaneseLiberianLithuanianLumbeeLuxembourgerMacedonianMalaysianMalteseMarshalleseMenomineeMexicanMexican American IndianMongolianMoroccanNative HawaiianNavajoNepaleseNew ZealanderNicaraguanNigerianNorthern EuropeanNorwegianOkinawanOsageOttawaPaiutePakistaniPalestinianPanamanianParaguayanPennsylvania GermanPeruvianPimaPolishPortuguesePotawatomiPuebloPuerto RicanPuget Sound SalishRomanianRussianSalvadoranSamoanScandinavianScotch-IrishScottishSeminoleSenegaleseSerbianShoshoneSierra LeoneanSiouxSlavicSlovakSloveneSomaliSouth AfricanSouth AmericanSouth American IndianSoviet UnionSpaniardSpanishSpanish AmericanSpanish American IndianSri LankanSubsaharan AfricanSudaneseSwedishSwissSyrianTaiwaneseThaiTlingit-HaidaTohono O'OdhamTonganTrinidadian and TobagonianTsimshianTurkishU.S. Virgin IslanderUgandanUkrainianUruguayanUteVenezuelanVietnameseWelshWest IndianYakamaYaquiYugoslavianYumanYup'ikZimbabwean
Immigration
NonimmigrantsImmigrantsAfghanistanAfricaAlbaniaArgentinaArmeniaAsiaAustraliaAustriaBahamasBangladeshBarbadosBelarusBelgiumBelizeBoliviaBosnia and HerzegovinaBrazilBulgariaBurma/MyanmarCabo VerdeCambodiaCameroonCanadaCaribbeanCentral AmericaChileChinaColombiaCongoCosta RicaCroatiaCubaCzechoslovakiaDenmarkDominicaDominican RepublicEastern AfricaEastern AsiaEastern EuropeEcuadorEgyptEl SalvadorEnglandEritreaEthiopiaEuropeFijiFranceGermanyGhanaGreeceGrenadaGuatemalaGuyanaHaitiHondurasHong KongHungaryIndiaIndonesiaIranIraqIrelandIsraelItalyJamaicaJapanJordanKazakhstanKenyaKoreaKuwaitLaosLatin AmericaLatviaLebanonLiberiaLithuaniaMalaysiaMexicoMicronesiaMiddle AfricaMoldovaMoroccoNepalNetherlandsNicaraguaNigeriaNorth AmericaNorth MacedoniaNorthern AfricaNorthern EuropeNorwayOceaniaPakistanPanamaPeruPhilippinesPolandPortugalRomaniaRussiaSaudi ArabiaScotlandSenegalSerbiaSierra LeoneSingaporeSomaliaSouth AfricaSouth AmericaSouth Central AsiaSouth Eastern AsiaSouthern EuropeSpainSri LankaSt. Vincent and the GrenadinesSudanSwedenSwitzerlandSyriaTaiwanThailandTrinidad and TobagoTurkeyUgandaUruguayUzbekistanVenezuelaVietnamWest IndiesWestern AfricaWestern AsiaWestern EuropeYemenZaireZimbabweAzores
Immigrants from Ukraine
Race
Ancestry
AfghanAfricanAlaska NativeAlaskan AthabascanAlbanianAleutAlsatianAmericanApacheArabArapahoArgentineanArmenianAssyrian/Chaldean/SyriacAustralianAustrianBahamianBangladeshiBarbadianBasqueBelgianBelizeanBermudanBhutaneseBlackfeetBolivianBrazilianBritishBritish West IndianBulgarianBurmeseCambodianCanadianCape VerdeanCarpatho RusynCelticCentral AmericanCentral American IndianCherokeeCheyenneChickasawChileanChineseChippewaChoctawColombianColvilleComancheCosta RicanCreeCreekCroatianCrowCubanCypriotCzechCzechoslovakianDanishDelawareDominicanDutchDutch West IndianEastern EuropeanEcuadorianEgyptianEnglishEstonianEthiopianEuropeanFijianFilipinoFinnishFrenchFrench American IndianFrench CanadianGermanGerman RussianGhanaianGreekGuamanian/ChamorroGuatemalanGuyaneseHaitianHmongHonduranHopiHoumaHungarianIcelanderIndian (Asian)IndonesianInupiatIranianIraqiIrishIroquoisIsraeliItalianJamaicanJapaneseJordanianKenyanKiowaKoreanLaotianLatvianLebaneseLiberianLithuanianLumbeeLuxembourgerMacedonianMalaysianMalteseMarshalleseMenomineeMexicanMexican American IndianMongolianMoroccanNative HawaiianNavajoNepaleseNew ZealanderNicaraguanNigerianNorthern EuropeanNorwegianOkinawanOsageOttawaPaiutePakistaniPalestinianPanamanianParaguayanPennsylvania GermanPeruvianPimaPolishPortuguesePotawatomiPuebloPuerto RicanPuget Sound SalishRomanianRussianSalvadoranSamoanScandinavianScotch-IrishScottishSeminoleSenegaleseSerbianShoshoneSierra LeoneanSiouxSlavicSlovakSloveneSomaliSouth AfricanSouth AmericanSouth American IndianSoviet UnionSpaniardSpanishSpanish AmericanSpanish American IndianSri LankanSubsaharan AfricanSudaneseSwedishSwissSyrianTaiwaneseThaiTlingit-HaidaTohono O'OdhamTonganTrinidadian and TobagonianTsimshianTurkishU.S. Virgin IslanderUgandanUkrainianUruguayanUteVenezuelanVietnameseWelshWest IndianYakamaYaquiYugoslavianYumanYup'ikZimbabwean
Immigration
NonimmigrantsImmigrantsAfghanistanAfricaAlbaniaArgentinaArmeniaAsiaAustraliaAustriaBahamasBangladeshBarbadosBelarusBelgiumBelizeBoliviaBosnia and HerzegovinaBrazilBulgariaBurma/MyanmarCabo VerdeCambodiaCameroonCanadaCaribbeanCentral AmericaChileChinaColombiaCongoCosta RicaCroatiaCubaCzechoslovakiaDenmarkDominicaDominican RepublicEastern AfricaEastern AsiaEastern EuropeEcuadorEgyptEl SalvadorEnglandEritreaEthiopiaEuropeFijiFranceGermanyGhanaGreeceGrenadaGuatemalaGuyanaHaitiHondurasHong KongHungaryIndiaIndonesiaIranIraqIrelandIsraelItalyJamaicaJapanJordanKazakhstanKenyaKoreaKuwaitLaosLatin AmericaLatviaLebanonLiberiaLithuaniaMalaysiaMexicoMicronesiaMiddle AfricaMoldovaMoroccoNepalNetherlandsNicaraguaNigeriaNorth AmericaNorth MacedoniaNorthern AfricaNorthern EuropeNorwayOceaniaPakistanPanamaPeruPhilippinesPolandPortugalRomaniaRussiaSaudi ArabiaScotlandSenegalSerbiaSierra LeoneSingaporeSomaliaSouth AfricaSouth AmericaSouth Central AsiaSouth Eastern AsiaSouthern EuropeSpainSri LankaSt. Vincent and the GrenadinesSudanSwedenSwitzerlandSyriaTaiwanThailandTrinidad and TobagoTurkeyUgandaUkraineUruguayUzbekistanVenezuelaVietnamWest IndiesWestern AfricaWestern AsiaWestern EuropeYemenZaireZimbabweAzores
4th Grade
Income
Poverty
Unemployment
Labor Participation
Family Structure
Vehicle Availability
Education Level
Disability

4th Grade Comparison

Cajuns

Immigrants from Ukraine

Exceptional
Fair
98.0%
4TH GRADE
99.7/ 100
METRIC RATING
64th/ 347
METRIC RANK
97.4%
4TH GRADE
30.1/ 100
METRIC RATING
192nd/ 347
METRIC RANK

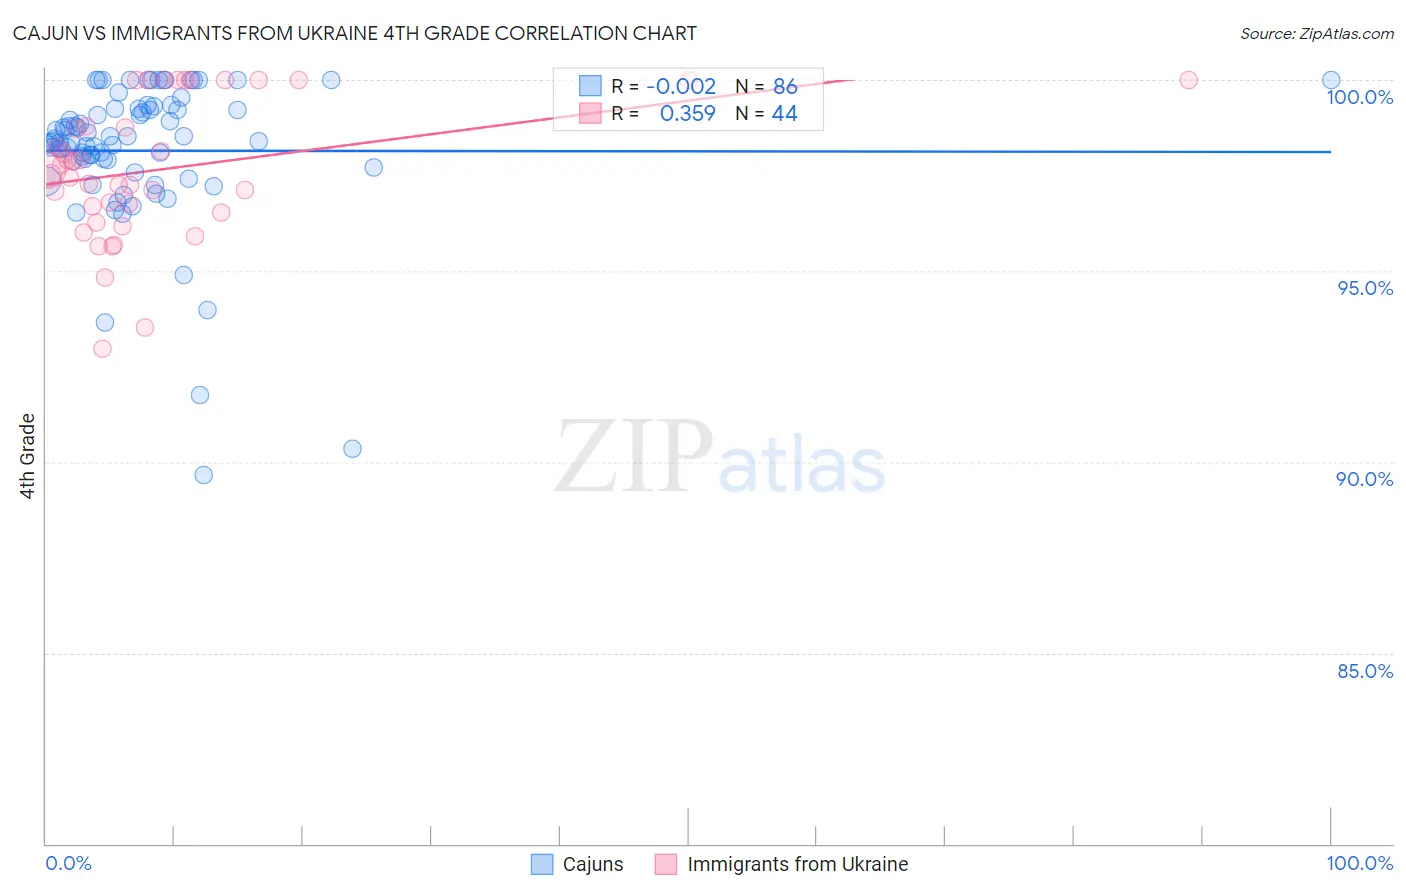
Cajun vs Immigrants from Ukraine 4th Grade Correlation Chart

The statistical analysis conducted on geographies consisting of 149,712,957 people shows no correlation between the proportion of Cajuns and percentage of population with at least 4th grade education in the United States with a correlation coefficient (R) of -0.002 and weighted average of 98.0%. Similarly, the statistical analysis conducted on geographies consisting of 289,712,791 people shows a mild positive correlation between the proportion of Immigrants from Ukraine and percentage of population with at least 4th grade education in the United States with a correlation coefficient (R) of 0.359 and weighted average of 97.4%, a difference of 0.61%.
Cajun vs Immigrants from Ukraine 4th Grade

4th Grade Correlation Summary

MeasurementCajunImmigrants from Ukraine
Minimum89.7%93.0%
Maximum100.0%100.0%
Range10.3%7.0%
Mean98.1%97.7%
Median98.4%97.6%
Interquartile 25% (IQ1)97.9%96.6%
Interquartile 75% (IQ3)99.2%99.4%
Interquartile Range (IQR)1.4%2.8%
Standard Deviation (Sample)1.9%1.8%
Standard Deviation (Population)1.9%1.8%

Similar Demographics by 4th Grade

Demographics Similar to Cajuns by 4th Grade

In terms of 4th grade, the demographic groups most similar to Cajuns are Immigrants from Northern Europe (98.0%, a difference of 0.0%), Serbian (98.1%, a difference of 0.010%), Russian (98.0%, a difference of 0.010%), Canadian (98.0%, a difference of 0.010%), and New Zealander (98.0%, a difference of 0.010%).
DemographicsRating | Rank4th Grade
Austrians
99.8
/100
|
#57
Exceptional
98.1%
Creek
99.8
/100
|
#58
Exceptional
98.1%
Americans
99.8
/100
|
#59
Exceptional
98.1%
Immigrants | Canada
99.7
/100
|
#60
Exceptional
98.1%
Immigrants | North America
99.7
/100
|
#61
Exceptional
98.1%
Serbians
99.7
/100
|
#62
Exceptional
98.1%
Russians
99.7
/100
|
#63
Exceptional
98.0%
Cajuns
99.7
/100
|
#64
Exceptional
98.0%
Immigrants | Northern Europe
99.6
/100
|
#65
Exceptional
98.0%
Canadians
99.6
/100
|
#66
Exceptional
98.0%
New Zealanders
99.6
/100
|
#67
Exceptional
98.0%
Kiowa
99.6
/100
|
#68
Exceptional
98.0%
Pueblo
99.6
/100
|
#69
Exceptional
98.0%
Immigrants | Austria
99.6
/100
|
#70
Exceptional
98.0%
Lumbee
99.6
/100
|
#71
Exceptional
98.0%

Demographics Similar to Immigrants from Ukraine by 4th Grade

In terms of 4th grade, the demographic groups most similar to Immigrants from Ukraine are Black/African American (97.4%, a difference of 0.0%), Navajo (97.4%, a difference of 0.0%), Immigrants from Egypt (97.4%, a difference of 0.0%), Portuguese (97.4%, a difference of 0.0%), and Panamanian (97.4%, a difference of 0.010%).
DemographicsRating | Rank4th Grade
Immigrants | Kenya
35.8
/100
|
#185
Fair
97.5%
Dutch West Indians
35.8
/100
|
#186
Fair
97.5%
Mongolians
34.7
/100
|
#187
Fair
97.5%
Immigrants | Argentina
34.6
/100
|
#188
Fair
97.5%
Panamanians
31.9
/100
|
#189
Fair
97.4%
Blacks/African Americans
31.1
/100
|
#190
Fair
97.4%
Navajo
30.7
/100
|
#191
Fair
97.4%
Immigrants | Ukraine
30.1
/100
|
#192
Fair
97.4%
Immigrants | Egypt
30.1
/100
|
#193
Fair
97.4%
Portuguese
29.2
/100
|
#194
Fair
97.4%
Paraguayans
28.9
/100
|
#195
Fair
97.4%
Immigrants | Albania
27.7
/100
|
#196
Fair
97.4%
Hawaiians
25.6
/100
|
#197
Fair
97.4%
Guamanians/Chamorros
23.0
/100
|
#198
Fair
97.4%
Natives/Alaskans
20.6
/100
|
#199
Fair
97.4%