Cajun vs Chinese 4th Grade
COMPARE
Cajun
Chinese
4th Grade
4th Grade Comparison
Cajuns
Chinese
98.0%
4TH GRADE
99.7/ 100
METRIC RATING
64th/ 347
METRIC RANK
98.3%
4TH GRADE
100.0/ 100
METRIC RATING
32nd/ 347
METRIC RANK
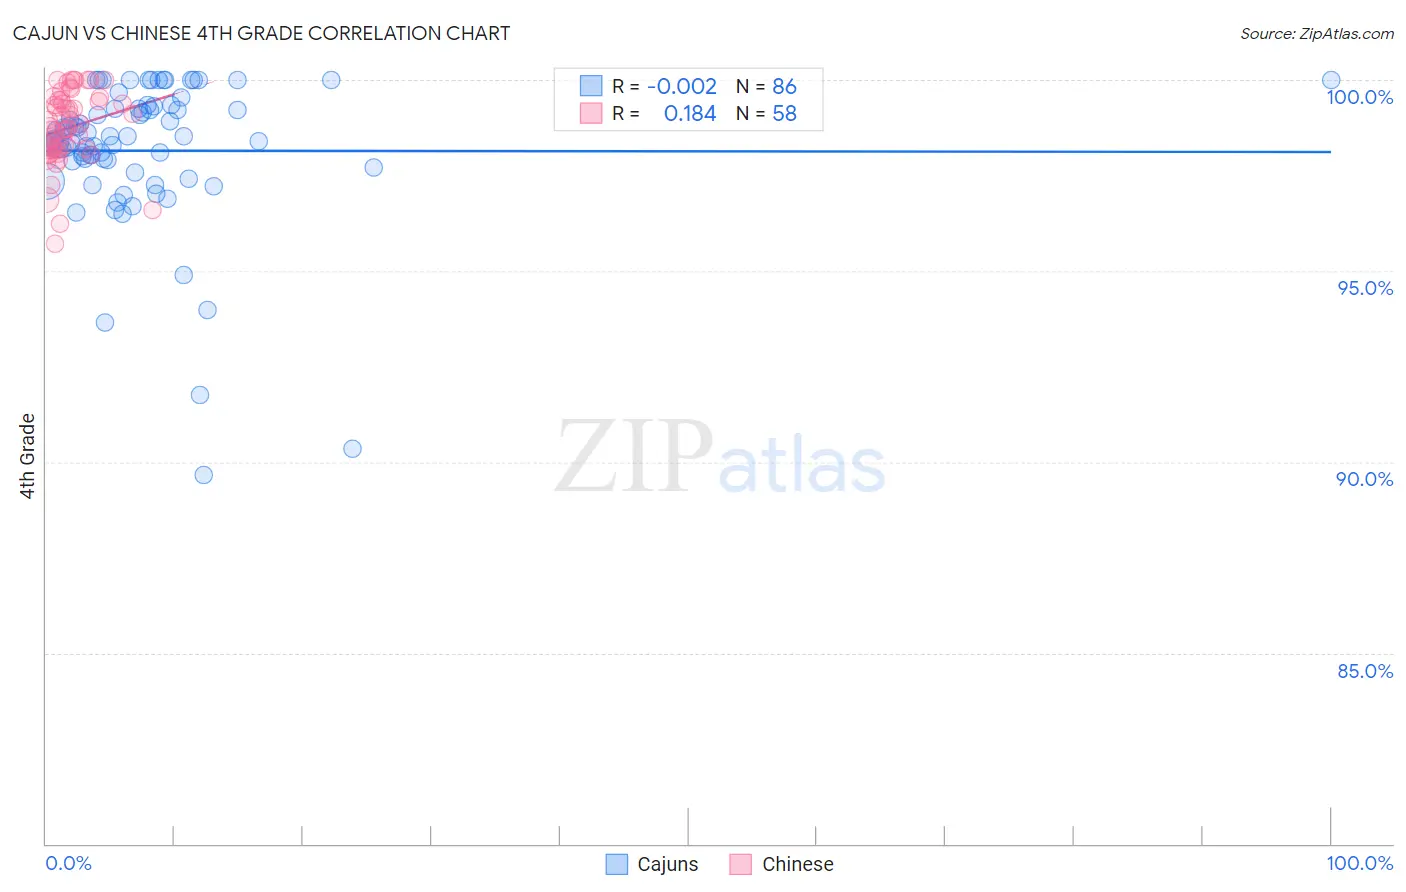
Cajun vs Chinese 4th Grade Correlation Chart
The statistical analysis conducted on geographies consisting of 149,712,957 people shows no correlation between the proportion of Cajuns and percentage of population with at least 4th grade education in the United States with a correlation coefficient (R) of -0.002 and weighted average of 98.0%. Similarly, the statistical analysis conducted on geographies consisting of 64,808,307 people shows a poor positive correlation between the proportion of Chinese and percentage of population with at least 4th grade education in the United States with a correlation coefficient (R) of 0.184 and weighted average of 98.3%, a difference of 0.22%.
4th Grade Correlation Summary
| Measurement | Cajun | Chinese |
| Minimum | 89.7% | 95.7% |
| Maximum | 100.0% | 100.0% |
| Range | 10.3% | 4.3% |
| Mean | 98.1% | 98.7% |
| Median | 98.4% | 98.8% |
| Interquartile 25% (IQ1) | 97.9% | 98.2% |
| Interquartile 75% (IQ3) | 99.2% | 99.5% |
| Interquartile Range (IQR) | 1.4% | 1.3% |
| Standard Deviation (Sample) | 1.9% | 0.97% |
| Standard Deviation (Population) | 1.9% | 0.96% |
Similar Demographics by 4th Grade
Demographics Similar to Cajuns by 4th Grade
In terms of 4th grade, the demographic groups most similar to Cajuns are Immigrants from Northern Europe (98.0%, a difference of 0.0%), Serbian (98.1%, a difference of 0.010%), Russian (98.0%, a difference of 0.010%), Canadian (98.0%, a difference of 0.010%), and New Zealander (98.0%, a difference of 0.010%).
| Demographics | Rating | Rank | 4th Grade |
| Austrians | 99.8 /100 | #57 | Exceptional 98.1% |
| Creek | 99.8 /100 | #58 | Exceptional 98.1% |
| Americans | 99.8 /100 | #59 | Exceptional 98.1% |
| Immigrants | Canada | 99.7 /100 | #60 | Exceptional 98.1% |
| Immigrants | North America | 99.7 /100 | #61 | Exceptional 98.1% |
| Serbians | 99.7 /100 | #62 | Exceptional 98.1% |
| Russians | 99.7 /100 | #63 | Exceptional 98.0% |
| Cajuns | 99.7 /100 | #64 | Exceptional 98.0% |
| Immigrants | Northern Europe | 99.6 /100 | #65 | Exceptional 98.0% |
| Canadians | 99.6 /100 | #66 | Exceptional 98.0% |
| New Zealanders | 99.6 /100 | #67 | Exceptional 98.0% |
| Kiowa | 99.6 /100 | #68 | Exceptional 98.0% |
| Pueblo | 99.6 /100 | #69 | Exceptional 98.0% |
| Immigrants | Austria | 99.6 /100 | #70 | Exceptional 98.0% |
| Lumbee | 99.6 /100 | #71 | Exceptional 98.0% |
Demographics Similar to Chinese by 4th Grade
In terms of 4th grade, the demographic groups most similar to Chinese are Swiss (98.2%, a difference of 0.010%), Chippewa (98.2%, a difference of 0.020%), Italian (98.2%, a difference of 0.020%), Scandinavian (98.3%, a difference of 0.030%), and European (98.3%, a difference of 0.030%).
| Demographics | Rating | Rank | 4th Grade |
| Scotch-Irish | 100.0 /100 | #25 | Exceptional 98.3% |
| Croatians | 100.0 /100 | #26 | Exceptional 98.3% |
| French Canadians | 100.0 /100 | #27 | Exceptional 98.3% |
| French | 100.0 /100 | #28 | Exceptional 98.3% |
| Czechs | 100.0 /100 | #29 | Exceptional 98.3% |
| Scandinavians | 100.0 /100 | #30 | Exceptional 98.3% |
| Europeans | 100.0 /100 | #31 | Exceptional 98.3% |
| Chinese | 100.0 /100 | #32 | Exceptional 98.3% |
| Swiss | 100.0 /100 | #33 | Exceptional 98.2% |
| Chippewa | 100.0 /100 | #34 | Exceptional 98.2% |
| Italians | 100.0 /100 | #35 | Exceptional 98.2% |
| British | 100.0 /100 | #36 | Exceptional 98.2% |
| Latvians | 99.9 /100 | #37 | Exceptional 98.2% |
| Aleuts | 99.9 /100 | #38 | Exceptional 98.2% |
| Belgians | 99.9 /100 | #39 | Exceptional 98.2% |