Bermudan vs Pennsylvania German 9th Grade
COMPARE
Bermudan
Pennsylvania German
9th Grade
9th Grade Comparison
Bermudans
Pennsylvania Germans
95.0%
9TH GRADE
65.8/ 100
METRIC RATING
162nd/ 347
METRIC RANK
93.3%
9TH GRADE
0.0/ 100
METRIC RATING
290th/ 347
METRIC RANK
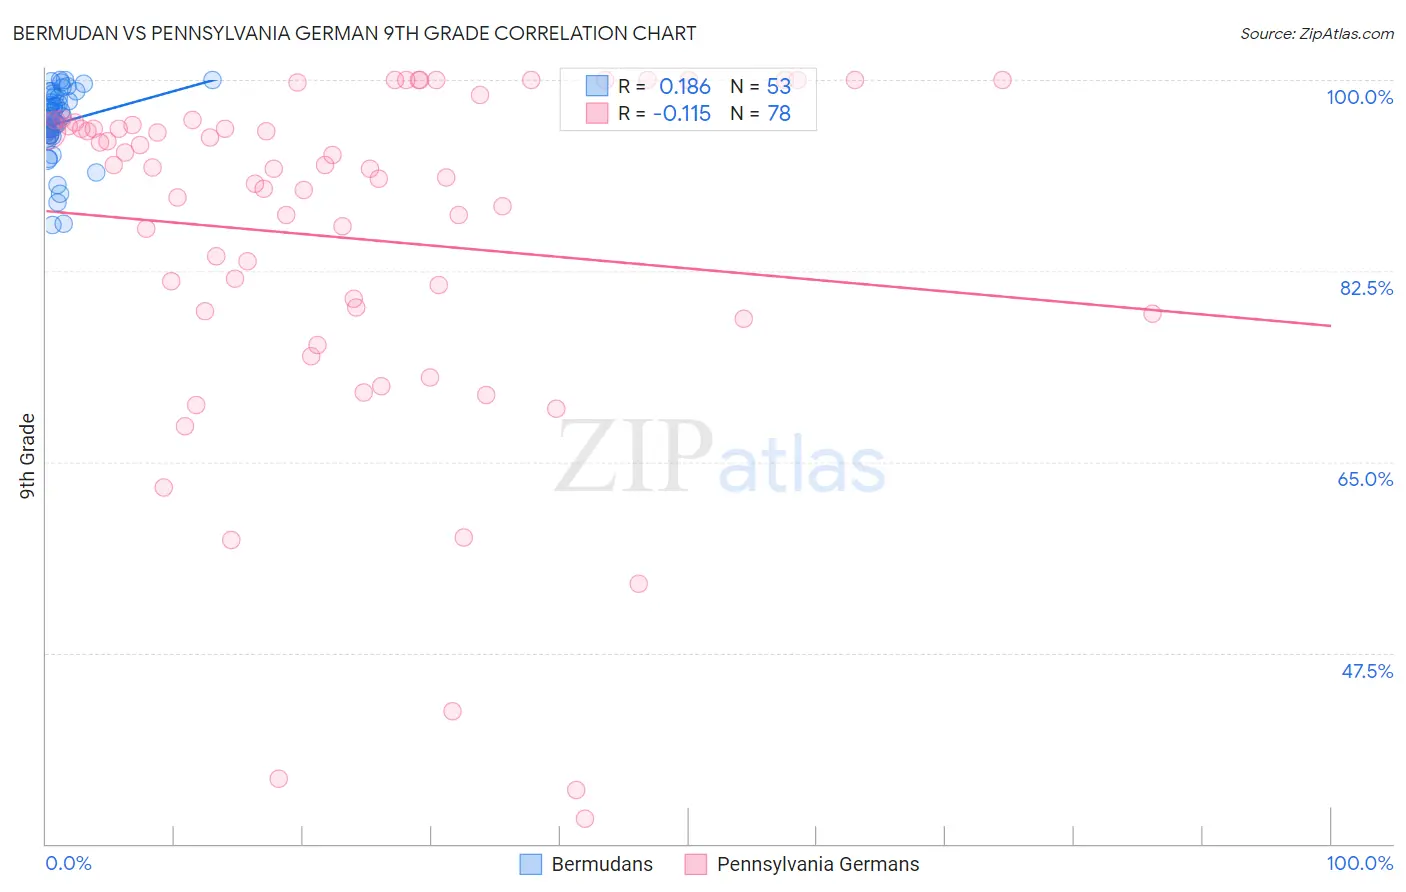
Bermudan vs Pennsylvania German 9th Grade Correlation Chart
The statistical analysis conducted on geographies consisting of 55,732,793 people shows a poor positive correlation between the proportion of Bermudans and percentage of population with at least 9th grade education in the United States with a correlation coefficient (R) of 0.186 and weighted average of 95.0%. Similarly, the statistical analysis conducted on geographies consisting of 234,103,120 people shows a poor negative correlation between the proportion of Pennsylvania Germans and percentage of population with at least 9th grade education in the United States with a correlation coefficient (R) of -0.115 and weighted average of 93.3%, a difference of 1.8%.
9th Grade Correlation Summary
| Measurement | Bermudan | Pennsylvania German |
| Minimum | 86.7% | 32.3% |
| Maximum | 100.0% | 100.0% |
| Range | 13.3% | 67.7% |
| Mean | 96.1% | 85.5% |
| Median | 96.6% | 91.9% |
| Interquartile 25% (IQ1) | 94.9% | 78.8% |
| Interquartile 75% (IQ3) | 98.5% | 95.8% |
| Interquartile Range (IQR) | 3.6% | 17.0% |
| Standard Deviation (Sample) | 3.2% | 16.2% |
| Standard Deviation (Population) | 3.2% | 16.1% |
Similar Demographics by 9th Grade
Demographics Similar to Bermudans by 9th Grade
In terms of 9th grade, the demographic groups most similar to Bermudans are Immigrants from Ukraine (95.0%, a difference of 0.010%), Immigrants from Italy (95.0%, a difference of 0.010%), French American Indian (95.0%, a difference of 0.010%), Pakistani (95.0%, a difference of 0.010%), and Venezuelan (95.0%, a difference of 0.020%).
| Demographics | Rating | Rank | 9th Grade |
| Immigrants | Kazakhstan | 74.7 /100 | #155 | Good 95.1% |
| Immigrants | Kenya | 73.1 /100 | #156 | Good 95.0% |
| Mongolians | 73.0 /100 | #157 | Good 95.0% |
| Egyptians | 70.1 /100 | #158 | Good 95.0% |
| Immigrants | Ukraine | 67.4 /100 | #159 | Good 95.0% |
| Immigrants | Italy | 66.6 /100 | #160 | Good 95.0% |
| French American Indians | 66.5 /100 | #161 | Good 95.0% |
| Bermudans | 65.8 /100 | #162 | Good 95.0% |
| Pakistanis | 64.1 /100 | #163 | Good 95.0% |
| Venezuelans | 63.6 /100 | #164 | Good 95.0% |
| Blackfeet | 62.6 /100 | #165 | Good 95.0% |
| Ute | 62.6 /100 | #166 | Good 95.0% |
| Immigrants | Brazil | 61.1 /100 | #167 | Good 95.0% |
| Chileans | 60.7 /100 | #168 | Good 95.0% |
| Spaniards | 59.6 /100 | #169 | Average 94.9% |
Demographics Similar to Pennsylvania Germans by 9th Grade
In terms of 9th grade, the demographic groups most similar to Pennsylvania Germans are Immigrants from West Indies (93.3%, a difference of 0.0%), Immigrants from South Eastern Asia (93.3%, a difference of 0.070%), British West Indian (93.2%, a difference of 0.080%), Immigrants from Barbados (93.4%, a difference of 0.10%), and Immigrants from St. Vincent and the Grenadines (93.4%, a difference of 0.10%).
| Demographics | Rating | Rank | 9th Grade |
| Barbadians | 0.0 /100 | #283 | Tragic 93.5% |
| Bangladeshis | 0.0 /100 | #284 | Tragic 93.4% |
| Immigrants | Peru | 0.0 /100 | #285 | Tragic 93.4% |
| Immigrants | Barbados | 0.0 /100 | #286 | Tragic 93.4% |
| Immigrants | St. Vincent and the Grenadines | 0.0 /100 | #287 | Tragic 93.4% |
| Immigrants | South Eastern Asia | 0.0 /100 | #288 | Tragic 93.3% |
| Immigrants | West Indies | 0.0 /100 | #289 | Tragic 93.3% |
| Pennsylvania Germans | 0.0 /100 | #290 | Tragic 93.3% |
| British West Indians | 0.0 /100 | #291 | Tragic 93.2% |
| Immigrants | Laos | 0.0 /100 | #292 | Tragic 93.2% |
| Sri Lankans | 0.0 /100 | #293 | Tragic 93.2% |
| Cubans | 0.0 /100 | #294 | Tragic 93.2% |
| Immigrants | Burma/Myanmar | 0.0 /100 | #295 | Tragic 93.1% |
| Indonesians | 0.0 /100 | #296 | Tragic 93.1% |
| Fijians | 0.0 /100 | #297 | Tragic 93.1% |