Bermudan vs Immigrants from Africa 9th Grade

COMPARE

Bermudan
Race
Ancestry
AfghanAfricanAlaska NativeAlaskan AthabascanAlbanianAleutAlsatianAmericanApacheArabArapahoArgentineanArmenianAssyrian/Chaldean/SyriacAustralianAustrianBahamianBangladeshiBarbadianBasqueBelgianBelizeanBermudanBhutaneseBlackfeetBolivianBrazilianBritishBritish West IndianBulgarianBurmeseCajunCambodianCanadianCape VerdeanCarpatho RusynCelticCentral AmericanCentral American IndianCherokeeCheyenneChickasawChileanChineseChippewaChoctawColombianColvilleComancheCosta RicanCreeCreekCroatianCrowCubanCypriotCzechCzechoslovakianDanishDelawareDominicanDutchDutch West IndianEastern EuropeanEcuadorianEgyptianEnglishEstonianEthiopianEuropeanFijianFilipinoFinnishFrenchFrench American IndianFrench CanadianGermanGerman RussianGhanaianGreekGuamanian/ChamorroGuatemalanGuyaneseHaitianHmongHonduranHopiHoumaHungarianIcelanderIndian (Asian)IndonesianInupiatIranianIraqiIrishIroquoisIsraeliItalianJamaicanJapaneseJordanianKenyanKiowaKoreanLaotianLatvianLebaneseLiberianLithuanianLumbeeLuxembourgerMacedonianMalaysianMalteseMarshalleseMenomineeMexicanMexican American IndianMongolianMoroccanNative HawaiianNavajoNepaleseNew ZealanderNicaraguanNigerianNorthern EuropeanNorwegianOkinawanOsageOttawaPaiutePakistaniPalestinianPanamanianParaguayanPennsylvania GermanPeruvianPimaPolishPortuguesePotawatomiPuebloPuerto RicanPuget Sound SalishRomanianRussianSalvadoranSamoanScandinavianScotch-IrishScottishSeminoleSenegaleseSerbianShoshoneSierra LeoneanSiouxSlavicSlovakSloveneSomaliSouth AfricanSouth AmericanSouth American IndianSoviet UnionSpaniardSpanishSpanish AmericanSpanish American IndianSri LankanSubsaharan AfricanSudaneseSwedishSwissSyrianTaiwaneseThaiTlingit-HaidaTohono O'OdhamTonganTrinidadian and TobagonianTsimshianTurkishU.S. Virgin IslanderUgandanUkrainianUruguayanUteVenezuelanVietnameseWelshWest IndianYakamaYaquiYugoslavianYumanYup'ikZimbabwean
Immigration
NonimmigrantsImmigrantsAfghanistanAlbaniaArgentinaArmeniaAsiaAustraliaAustriaBahamasBangladeshBarbadosBelarusBelgiumBelizeBoliviaBosnia and HerzegovinaBrazilBulgariaBurma/MyanmarCabo VerdeCambodiaCameroonCanadaCaribbeanCentral AmericaChileChinaColombiaCongoCosta RicaCroatiaCubaCzechoslovakiaDenmarkDominicaDominican RepublicEastern AfricaEastern AsiaEastern EuropeEcuadorEgyptEl SalvadorEnglandEritreaEthiopiaEuropeFijiFranceGermanyGhanaGreeceGrenadaGuatemalaGuyanaHaitiHondurasHong KongHungaryIndiaIndonesiaIranIraqIrelandIsraelItalyJamaicaJapanJordanKazakhstanKenyaKoreaKuwaitLaosLatin AmericaLatviaLebanonLiberiaLithuaniaMalaysiaMexicoMicronesiaMiddle AfricaMoldovaMoroccoNepalNetherlandsNicaraguaNigeriaNorth AmericaNorth MacedoniaNorthern AfricaNorthern EuropeNorwayOceaniaPakistanPanamaPeruPhilippinesPolandPortugalRomaniaRussiaSaudi ArabiaScotlandSenegalSerbiaSierra LeoneSingaporeSomaliaSouth AfricaSouth AmericaSouth Central AsiaSouth Eastern AsiaSouthern EuropeSpainSri LankaSt. Vincent and the GrenadinesSudanSwedenSwitzerlandSyriaTaiwanThailandTrinidad and TobagoTurkeyUgandaUkraineUruguayUzbekistanVenezuelaVietnamWest IndiesWestern AfricaWestern AsiaWestern EuropeYemenZaireZimbabweAzores
Immigrants from Africa
Race
Ancestry
AfghanAfricanAlaska NativeAlaskan AthabascanAlbanianAleutAlsatianAmericanApacheArabArapahoArgentineanArmenianAssyrian/Chaldean/SyriacAustralianAustrianBahamianBangladeshiBarbadianBasqueBelgianBelizeanBhutaneseBlackfeetBolivianBrazilianBritishBritish West IndianBulgarianBurmeseCajunCambodianCanadianCape VerdeanCarpatho RusynCelticCentral AmericanCentral American IndianCherokeeCheyenneChickasawChileanChineseChippewaChoctawColombianColvilleComancheCosta RicanCreeCreekCroatianCrowCubanCypriotCzechCzechoslovakianDanishDelawareDominicanDutchDutch West IndianEastern EuropeanEcuadorianEgyptianEnglishEstonianEthiopianEuropeanFijianFilipinoFinnishFrenchFrench American IndianFrench CanadianGermanGerman RussianGhanaianGreekGuamanian/ChamorroGuatemalanGuyaneseHaitianHmongHonduranHopiHoumaHungarianIcelanderIndian (Asian)IndonesianInupiatIranianIraqiIrishIroquoisIsraeliItalianJamaicanJapaneseJordanianKenyanKiowaKoreanLaotianLatvianLebaneseLiberianLithuanianLumbeeLuxembourgerMacedonianMalaysianMalteseMarshalleseMenomineeMexicanMexican American IndianMongolianMoroccanNative HawaiianNavajoNepaleseNew ZealanderNicaraguanNigerianNorthern EuropeanNorwegianOkinawanOsageOttawaPaiutePakistaniPalestinianPanamanianParaguayanPennsylvania GermanPeruvianPimaPolishPortuguesePotawatomiPuebloPuerto RicanPuget Sound SalishRomanianRussianSalvadoranSamoanScandinavianScotch-IrishScottishSeminoleSenegaleseSerbianShoshoneSierra LeoneanSiouxSlavicSlovakSloveneSomaliSouth AfricanSouth AmericanSouth American IndianSoviet UnionSpaniardSpanishSpanish AmericanSpanish American IndianSri LankanSubsaharan AfricanSudaneseSwedishSwissSyrianTaiwaneseThaiTlingit-HaidaTohono O'OdhamTonganTrinidadian and TobagonianTsimshianTurkishU.S. Virgin IslanderUgandanUkrainianUruguayanUteVenezuelanVietnameseWelshWest IndianYakamaYaquiYugoslavianYumanYup'ikZimbabwean
Immigration
NonimmigrantsImmigrantsAfghanistanAfricaAlbaniaArgentinaArmeniaAsiaAustraliaAustriaBahamasBangladeshBarbadosBelarusBelgiumBelizeBoliviaBosnia and HerzegovinaBrazilBulgariaBurma/MyanmarCabo VerdeCambodiaCameroonCanadaCaribbeanCentral AmericaChileChinaColombiaCongoCosta RicaCroatiaCubaCzechoslovakiaDenmarkDominicaDominican RepublicEastern AfricaEastern AsiaEastern EuropeEcuadorEgyptEl SalvadorEnglandEritreaEthiopiaEuropeFijiFranceGermanyGhanaGreeceGrenadaGuatemalaGuyanaHaitiHondurasHong KongHungaryIndiaIndonesiaIranIraqIrelandIsraelItalyJamaicaJapanJordanKazakhstanKenyaKoreaKuwaitLaosLatin AmericaLatviaLebanonLiberiaLithuaniaMalaysiaMexicoMicronesiaMiddle AfricaMoldovaMoroccoNepalNetherlandsNicaraguaNigeriaNorth AmericaNorth MacedoniaNorthern AfricaNorthern EuropeNorwayOceaniaPakistanPanamaPeruPhilippinesPolandPortugalRomaniaRussiaSaudi ArabiaScotlandSenegalSerbiaSierra LeoneSingaporeSomaliaSouth AfricaSouth AmericaSouth Central AsiaSouth Eastern AsiaSouthern EuropeSpainSri LankaSt. Vincent and the GrenadinesSudanSwedenSwitzerlandSyriaTaiwanThailandTrinidad and TobagoTurkeyUgandaUkraineUruguayUzbekistanVenezuelaVietnamWest IndiesWestern AfricaWestern AsiaWestern EuropeYemenZaireZimbabweAzores
9th Grade
Income
Poverty
Unemployment
Labor Participation
Family Structure
Vehicle Availability
Education Level
Disability

9th Grade Comparison

Bermudans

Immigrants from Africa

Good
Tragic
95.0%
9TH GRADE
65.8/ 100
METRIC RATING
162nd/ 347
METRIC RANK
94.3%
9TH GRADE
3.9/ 100
METRIC RATING
232nd/ 347
METRIC RANK

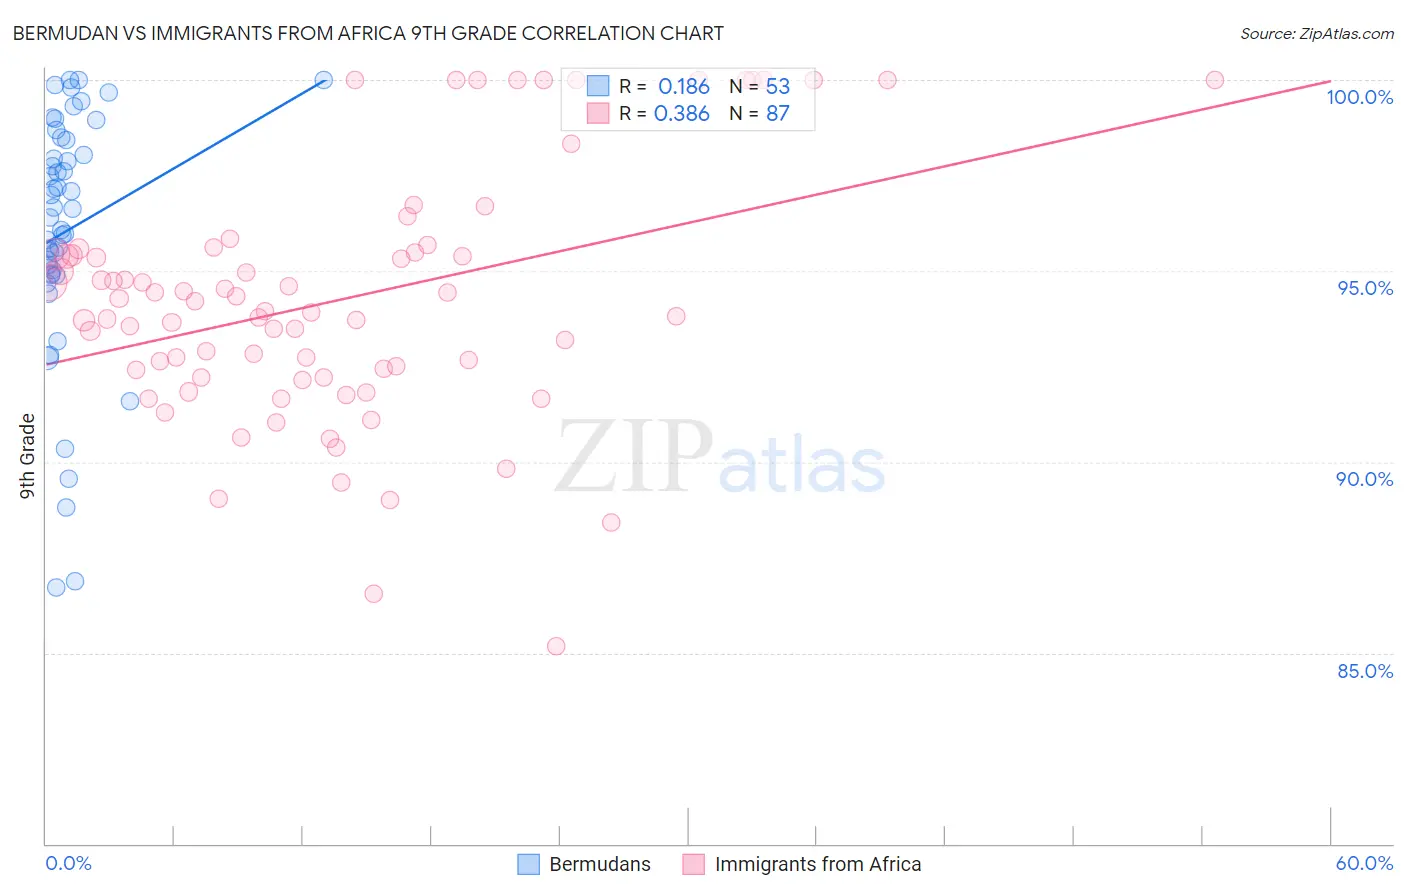
Bermudan vs Immigrants from Africa 9th Grade Correlation Chart

The statistical analysis conducted on geographies consisting of 55,732,793 people shows a poor positive correlation between the proportion of Bermudans and percentage of population with at least 9th grade education in the United States with a correlation coefficient (R) of 0.186 and weighted average of 95.0%. Similarly, the statistical analysis conducted on geographies consisting of 469,381,733 people shows a mild positive correlation between the proportion of Immigrants from Africa and percentage of population with at least 9th grade education in the United States with a correlation coefficient (R) of 0.386 and weighted average of 94.3%, a difference of 0.71%.
Bermudan vs Immigrants from Africa 9th Grade

9th Grade Correlation Summary

MeasurementBermudanImmigrants from Africa
Minimum86.7%85.2%
Maximum100.0%100.0%
Range13.3%14.8%
Mean96.1%94.2%
Median96.6%93.9%
Interquartile 25% (IQ1)94.9%92.2%
Interquartile 75% (IQ3)98.5%95.5%
Interquartile Range (IQR)3.6%3.3%
Standard Deviation (Sample)3.2%3.2%
Standard Deviation (Population)3.2%3.2%

Similar Demographics by 9th Grade

Demographics Similar to Bermudans by 9th Grade

In terms of 9th grade, the demographic groups most similar to Bermudans are Immigrants from Ukraine (95.0%, a difference of 0.010%), Immigrants from Italy (95.0%, a difference of 0.010%), French American Indian (95.0%, a difference of 0.010%), Pakistani (95.0%, a difference of 0.010%), and Venezuelan (95.0%, a difference of 0.020%).
DemographicsRating | Rank9th Grade
Immigrants | Kazakhstan
74.7
/100
|
#155
Good
95.1%
Immigrants | Kenya
73.1
/100
|
#156
Good
95.0%
Mongolians
73.0
/100
|
#157
Good
95.0%
Egyptians
70.1
/100
|
#158
Good
95.0%
Immigrants | Ukraine
67.4
/100
|
#159
Good
95.0%
Immigrants | Italy
66.6
/100
|
#160
Good
95.0%
French American Indians
66.5
/100
|
#161
Good
95.0%
Bermudans
65.8
/100
|
#162
Good
95.0%
Pakistanis
64.1
/100
|
#163
Good
95.0%
Venezuelans
63.6
/100
|
#164
Good
95.0%
Blackfeet
62.6
/100
|
#165
Good
95.0%
Ute
62.6
/100
|
#166
Good
95.0%
Immigrants | Brazil
61.1
/100
|
#167
Good
95.0%
Chileans
60.7
/100
|
#168
Good
95.0%
Spaniards
59.6
/100
|
#169
Average
94.9%

Demographics Similar to Immigrants from Africa by 9th Grade

In terms of 9th grade, the demographic groups most similar to Immigrants from Africa are Apache (94.3%, a difference of 0.010%), Immigrants from Panama (94.3%, a difference of 0.010%), Nigerian (94.3%, a difference of 0.010%), Costa Rican (94.3%, a difference of 0.020%), and Immigrants from Southern Europe (94.3%, a difference of 0.030%).
DemographicsRating | Rank9th Grade
Ethiopians
5.4
/100
|
#225
Tragic
94.4%
Sub-Saharan Africans
5.4
/100
|
#226
Tragic
94.4%
Immigrants | Sierra Leone
4.8
/100
|
#227
Tragic
94.4%
Lumbee
4.7
/100
|
#228
Tragic
94.4%
Immigrants | Southern Europe
4.5
/100
|
#229
Tragic
94.3%
Apache
4.2
/100
|
#230
Tragic
94.3%
Immigrants | Panama
4.0
/100
|
#231
Tragic
94.3%
Immigrants | Africa
3.9
/100
|
#232
Tragic
94.3%
Nigerians
3.7
/100
|
#233
Tragic
94.3%
Costa Ricans
3.5
/100
|
#234
Tragic
94.3%
Bolivians
3.3
/100
|
#235
Tragic
94.3%
Somalis
2.9
/100
|
#236
Tragic
94.3%
Koreans
2.9
/100
|
#237
Tragic
94.3%
South American Indians
2.8
/100
|
#238
Tragic
94.3%
Immigrants | China
2.8
/100
|
#239
Tragic
94.3%