Bermudan vs Mongolian High School Diploma
COMPARE
Bermudan
Mongolian
High School Diploma
High School Diploma Comparison
Bermudans
Mongolians
89.3%
HIGH SCHOOL DIPLOMA
61.1/ 100
METRIC RATING
162nd/ 347
METRIC RANK
89.9%
HIGH SCHOOL DIPLOMA
91.6/ 100
METRIC RATING
124th/ 347
METRIC RANK
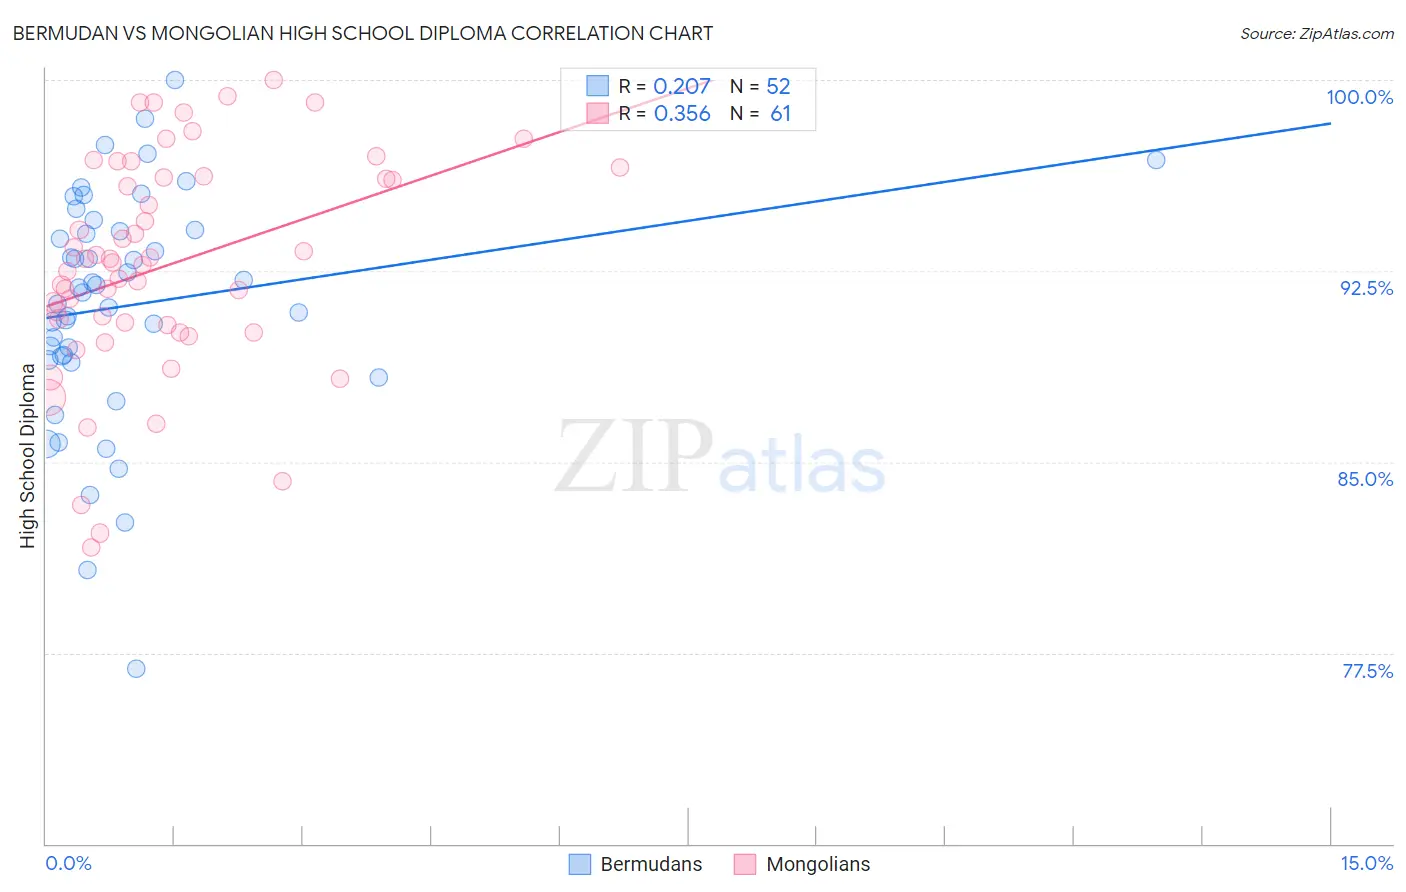
Bermudan vs Mongolian High School Diploma Correlation Chart
The statistical analysis conducted on geographies consisting of 55,730,379 people shows a weak positive correlation between the proportion of Bermudans and percentage of population with at least high school diploma education in the United States with a correlation coefficient (R) of 0.207 and weighted average of 89.3%. Similarly, the statistical analysis conducted on geographies consisting of 140,362,004 people shows a mild positive correlation between the proportion of Mongolians and percentage of population with at least high school diploma education in the United States with a correlation coefficient (R) of 0.356 and weighted average of 89.9%, a difference of 0.73%.
High School Diploma Correlation Summary
| Measurement | Bermudan | Mongolian |
| Minimum | 76.9% | 81.6% |
| Maximum | 100.0% | 100.0% |
| Range | 23.1% | 18.4% |
| Mean | 91.1% | 92.7% |
| Median | 91.7% | 92.8% |
| Interquartile 25% (IQ1) | 89.1% | 90.2% |
| Interquartile 75% (IQ3) | 94.1% | 96.2% |
| Interquartile Range (IQR) | 5.0% | 6.0% |
| Standard Deviation (Sample) | 4.6% | 4.3% |
| Standard Deviation (Population) | 4.5% | 4.3% |
Similar Demographics by High School Diploma
Demographics Similar to Bermudans by High School Diploma
In terms of high school diploma, the demographic groups most similar to Bermudans are Brazilian (89.3%, a difference of 0.0%), Cree (89.3%, a difference of 0.0%), Immigrants from Nepal (89.3%, a difference of 0.0%), Immigrants from China (89.3%, a difference of 0.010%), and Laotian (89.3%, a difference of 0.010%).
| Demographics | Rating | Rank | High School Diploma |
| Immigrants | Northern Africa | 66.4 /100 | #155 | Good 89.4% |
| Immigrants | Argentina | 65.5 /100 | #156 | Good 89.4% |
| Immigrants | Malaysia | 63.5 /100 | #157 | Good 89.3% |
| Immigrants | Pakistan | 62.5 /100 | #158 | Good 89.3% |
| Immigrants | China | 62.0 /100 | #159 | Good 89.3% |
| Laotians | 61.8 /100 | #160 | Good 89.3% |
| Brazilians | 61.2 /100 | #161 | Good 89.3% |
| Bermudans | 61.1 /100 | #162 | Good 89.3% |
| Cree | 61.1 /100 | #163 | Good 89.3% |
| Immigrants | Nepal | 61.1 /100 | #164 | Good 89.3% |
| Immigrants | Asia | 59.8 /100 | #165 | Average 89.3% |
| Immigrants | Albania | 59.4 /100 | #166 | Average 89.3% |
| Immigrants | Hong Kong | 58.6 /100 | #167 | Average 89.3% |
| Delaware | 55.8 /100 | #168 | Average 89.2% |
| Iroquois | 55.1 /100 | #169 | Average 89.2% |
Demographics Similar to Mongolians by High School Diploma
In terms of high school diploma, the demographic groups most similar to Mongolians are German Russian (90.0%, a difference of 0.020%), Egyptian (89.9%, a difference of 0.020%), Alaska Native (89.9%, a difference of 0.030%), Immigrants from Kazakhstan (90.0%, a difference of 0.10%), and Immigrants from Eastern Asia (89.9%, a difference of 0.10%).
| Demographics | Rating | Rank | High School Diploma |
| Jordanians | 95.4 /100 | #117 | Exceptional 90.2% |
| Israelis | 95.1 /100 | #118 | Exceptional 90.1% |
| Immigrants | Eastern Europe | 94.9 /100 | #119 | Exceptional 90.1% |
| Ottawa | 94.4 /100 | #120 | Exceptional 90.1% |
| Whites/Caucasians | 94.1 /100 | #121 | Exceptional 90.1% |
| Immigrants | Kazakhstan | 93.4 /100 | #122 | Exceptional 90.0% |
| German Russians | 92.0 /100 | #123 | Exceptional 90.0% |
| Mongolians | 91.6 /100 | #124 | Exceptional 89.9% |
| Egyptians | 91.1 /100 | #125 | Exceptional 89.9% |
| Alaska Natives | 91.0 /100 | #126 | Exceptional 89.9% |
| Immigrants | Eastern Asia | 89.2 /100 | #127 | Excellent 89.9% |
| Puget Sound Salish | 89.1 /100 | #128 | Excellent 89.9% |
| Basques | 88.5 /100 | #129 | Excellent 89.8% |
| Immigrants | Ukraine | 87.9 /100 | #130 | Excellent 89.8% |
| Immigrants | Italy | 87.4 /100 | #131 | Excellent 89.8% |